IELTS Academic Writing Task 1/ Graph Writing – Bar Graph + Pie Charts:
You should spend about 20 minutes on this task.
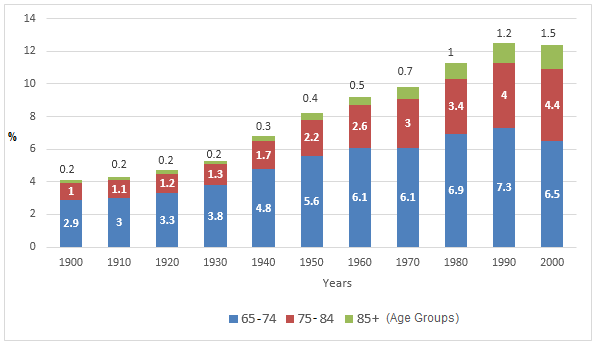
The chart below shows the percentage of the total US population aged 65 and over between 1900 and 2000.
Summarise the information by selecting and reporting the main features, and make comparisons where relevant.
You should write at least 150 words.
Percent of the Total Population age 65 and over between 1900 and 2000 in the USA.
Source: U.S. Census Bureau, decennial census of population, 1900 to 2000.
Sample Answer 1:
The column graph summarises the percentages of elderly citizens in the USA, who were 65 or older, between 1900 and 2000, based on the U.S. Census Bureau’s decennial census of population data.
Generally speaking, the ratio of senior citizens in the USA increased significantly over the period, and 65 to 74 years old were the highest in percentage – in terms of their ratio among the overall elderly Americans.
According to the graph, four out of a hundred Americans were above 64 in 1900, and the majority of them were between 65 to 74 years old at that time. Moreover, the ratio of people over 85 years old in this decade was very insignificant. After three decades, however, the elderly people’s ratio in the US reached over 5% and it kept on increasing until the end of the 20th century. Thus, almost one in ten US citizens was elderly in 1970, and 0.7% of them were 85 years old. The growth of senior citizens further accelerated after 1980 in the USA. As a consequence, during the last two decades of the 20th century, the USA was the home to 12% of senior citizens, and almost 4.5% of them were between 75 to 84 years old and 1.5% above 85 years old.
Model Answer 2:
The vertical line graph illustrates the proportion of Americans aged 65 and over between 1900 and 2000, with figures also given for the sub-groups aged 65–74, 75–84, and 85 and above.
Overall, the chart reveals a clear upward trend in the share of elderly people across all age brackets throughout the century. While the proportion of those aged 65–74 remained the largest, the oldest age group (85 and above) experienced the most rapid growth.
In 1900, only about four out of a hundred of the US population was aged 65 or older, with around 3% in the 65–74 bracket and roughly 1% in the 75–84 range. The proportion of people aged 85 and over was negligible at that time. Over the next fifty years, all age categories increased modestly, with the total elderly population rising to about 8% by 1950, when almost 5.5% were between the 65 and 74 age group.
From 1950 onwards, the rate of ageing accelerated, especially among the oldest group. After two decades, more specifically in 1970, almost one in every ten Americans was reported to be 65 or older, a significant growth in their ratio compared to the beginning of the century. Among this ratio, 3% were from the 75 to 84 age group, and over 6% from the 65 to 74 age group. Almost 2% were over 85, a noticeable improvement for this age group. This trend kept on growing till 2000, when approximately 13% Americans were senior citizens.
By 2000, around 7% of Americans were between 65 and 74, about 4% were aged 75–84, and nearly 2% were 85 or older. This meant that the total population aged 65 and above had approximately tripled over the century.
Sample Answer 3:
The bar graph depicts the percentages of senior citizens in the USA throughout the 20th century, according to the decennial census population data of the U.S. Census Bureau.
In general, the elderly population in the USA increased over the period from 1900 to 2000. 65 to 74 years old citizens were the highest in percentage among elderly Americans during this time.
As can be seen in the chart, four out of every hundred Americans were over 64 years old in 1900. Moreover, the ratio of people over 85 years old this year was insignificant. During the first three decades, the percentage of elderly people in the USA increased by merely 1%, and there was no change in the percentage of citizens aged over 85 years.
Then during the next sixty years, the percentage of senior citizens surged to a maximum of over 12% of the total population. However, in the last ten years of the century, the number dropped slightly. By the year 2000 majority of elderly people were between 65 to 74, which was 6.5%, and the citizens aged 85+ were only 1.5%.
[Written by – Kasun Madusanka Silva]
You can get the band score 7.
The bar chart illustrates the percentage of Americans who were in three different age groups over a century.
It is evident from the provided graph that the total percentage of the elderly followed an upward trend and reached a peak in 1990. However, it decreased slightly in 2000. In addition, the population of those aged 65 to 74 was by far more than that of other age groups.
Concerning people in the 65 to 74 age group, the percentage of them had risen steadily from 2.9 per cent to 5.6 per cent by 1950, before remaining the same for the next two decades at 6.1 per cent. Although this figure reached a peak of 7.3 per cent in 1990, there was a sharp decline to 6.5 per cent in 2000.
The percentage of Americans at the age of more than 85 remained relatively steady at 0.2 per cent from 1900 to 1930. After that, they saw a steady increase of 1.3 at the end of this period. Meanwhile, there was a steady rise in the percentage of the population aged 75 to 84, reaching from 1 per cent in 1900 to 4.4 per cent in 2000.
The chart presents the proportion of elderly citizens in the USA throughout the 20th century according to the decennial census population data of the U.S. Census Bureau.
Overall, elderly people’s percentage in the USA increased gradually and steadily throughout the century.
In detail, the elderly people constituted just less than 6% of the total American population from 1900 to 1930. But within the next 4 decades, their proportion rose significantly and in 1970, every one in ten Americans were over 64 years old. This rate kept on increasing, and in 1990, the USA had almost 13% population who were over 64 years old.
Elderly people, who were between 65 and 74 years, made up the largest proportion of senior citizens in the USA. In 1900, when the ratio of elderly was just 4%, the 65-74 age group constituted almost three-fourths of them. In 2000, their ratio was 6.5% while 75-84 made up 4% and the rest of the 13% were over 85 years old.
[quote name=”Jupi”]The bar chart illustrates the percentage of American people who were in three different age groups over a century.
It is evident from the provided graph that the total percentage of the elderly followed an upward trend and reached a cliff in 1990. However, it decreased slightly in 2000. In addition, the population of those aged 65 to 74 was by far more than other age groups.
Concerning people in the 65 to 74 age group, the percentage of them had risen steadily from 2.9 percent to 5.6 by 1950, before remaining the same for the next two decades at 6.1 percent. Although this figure reached a peak of 7.3 percent in 1990, there was a sharp decline to 6.5 in 2000.
The percentage of Americans at the age of more than 85 remained relatively steady at 0.2 percent from 1900 to 1930. After that, they saw a steady increase of 1.3 at the end of this period. Meanwhile, there was a steady rise in the percentage of the population aged 75 to 84, reaching from 1 percent in 1900 to 4.4 in 2000.
[/quote]
This graph was taken from a recent exam. I got that one in my test. The years and some data were different though.