Academic IELTS Writing Task 1 (Graph Writing) requires you to use different types of vocabulary to present the data given in a pie chart/ bar graph/ line graph/ mixed graph/table, or to describe a process diagram or a flow chart. Being able to use appropriate vocabulary, presenting the main trend, comparing & contrasting data and presenting the logical flow of the process ensures a high band score in your Academic Writing Task 1.
This vocabulary section aims to help you learn all the vocabulary, phrases and words you need to know and use in your Academic Writing Task 1 to achieve a higher band score. The examiner will use four criteria to score your response: task achievement, coherence and cohesion, lexical resource, & grammatical range and accuracy. Since “Lexical Resource” will determine 25% of your score in Writing Task 1, you have to enrich your vocabulary to hit a high band score. To demonstrate that you have a great lexical resource, you need to:
» Use correct synonyms in your writing.
» Use a range of vocabulary.
» Do not repeat words and phrases from the exam question unless there is no alternative.
» Use some less common vocabulary.
» Do not use the same word more than once/twice.
» Use precise and accurate words in a sentence.
You should learn synonyms and use them accurately in your writing to give the impression that you can use a good range of vocabulary.
Graph Writing Vocabulary Index:
Part 1 | Part 2 | Part 3 | Part 4 | Part 5 |
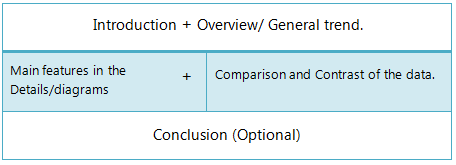
The general format for writing an academic writing task 1 is as follows:
Introduction + Basic/ General Trends + Details Description + Summary (optional).
Each part has a specific format, and therefore, being equipped with the necessary vocabulary will help you answer task 1 efficiently and will save a great deal of time.
Vocabulary for the Introduction Part:
| Starting | Presentation Type | Verb | Description |
| The/ the given / the supplied / the presented / the shown / the provided | diagram / table / figure / illustration / graph / chart / flow chart / picture/ presentation/ pie chart / bar graph/ column graph / line graph / table data/ data / information / pictorial/ process diagram/ map/ pie chart and table/ bar graph and pie chart … | shows / represents / depicts / enumerates / illustrates / presents/ gives / provides / delineates/ outlines/ describes / delineates/ expresses/ denotes/ compares/ shows contrast / indicates / figures / gives data on / gives information on/ presents information about/ shows data about/ demonstrates/ sketch out/ summarises… | the comparison of… the differences… the changes… the number of… information on… data on… the proportion of… the amount of… information on… data about… comparative data… the trend of… the percentages of… the ratio of… how the… |
Example:
1. The diagram shows employment rates among adults in four European countries from 1925 to 1985.
2. The given pie charts represent the proportion of male and female employees in 6 broad categories, divided into manual and non-manual occupations in Australia, between 2010 and 2015.
3. The chart gives information about consumer expenditures on six products in four countries, namely Germany, Italy, Britain and France.
4. The supplied bar graph compares the number of male and female graduates in three developing countries, while the table data presents the overall literacy rate in these countries.
5. The bar graph and the table data depict the water consumption in different sectors in five regions.
6. The bar graph enumerates the money spent on different research projects, while the column graph demonstrates the funding sources over a decade, commencing from 1981.
7. The line graph delineates the proportion of male and female employees in three different sectors in Australia between 2010 and 2015.
Note that some teachers prefer the “The line graph demonstrates…” instead of “The given line graph demonstrates…”. However, if you write “The given/ provided/ presented….” it would be correct as well.
Tips:
1. For a single graph use ‘s’ after the verb, like – gives data on, shows/ presents, etc. However, if there are multiple graphs, DO NOT use ‘s’ after the verb.
2. If there are multiple graphs and each one presents a different type of data, you can write which graph presents what type of data and use ‘while’ to show a connection. For example, ‘The given bar graph shows the amount spent on fast food items in 2009 in the UK, while the pie chart presents a comparison of people’s ages who spent more on fast food.
3. Your introduction should be quite impressive as it makes the first impression on the examiner. It either makes or breaks your overall score.
4. For multiple graphs and/ or table(s), you can write what they present in combination instead of saying which each graph depicts. For example, “The two pie charts and the column graph in combination depict a picture of the crime in Australia from 2005 to 2015 and the percentages of young offenders during this period.”
Caution:
Never copy word for word from the question. If you do, you would be penalised. Always paraphrase the introduction in your own words.
General Statement Part:
The General statement is the first sentence (or two) you write in your reporting. It should always deal with:
What + Where + When.
Example: The diagram presents information on the percentages of teachers who have expressed their views about the different problems they face when dealing with children in three Australian schools from 2001 to 2005.
What = the percentages of teachers…
Where = three Australian schools…
When = from 2001 to 2005…
A good General statement should always have these parts.
Vocabulary for the General Trend Part:
1. In general…
2. In common…
3. Generally speaking…
4. Overall…
5. It is obvious…
6. As it is observed…
7. As a general trend…
8. As can be seen…
9. As an overall trend/ As overall trend…
10. As it is presented…
11. It can be clearly seen that…
12. At a first glance…
13. It is clear,
14. At the onset…
15. It is clear that…
16. A glance at the graph(s) reveals that…
Example:
1. In general, the employment opportunities increased till 1970 and then declined throughout the next decade.
2. As it is observed, the figures for imprisonment in the five mentioned countries show no overall pattern, but rather show considerable fluctuations from country to country.
3. Generally speaking, citizens in the USA had a far better living standard than that of the remaining countries.
4. As can be seen, the highest number of passengers used the London Underground station at 8:00 in the morning and at 6:00 in the evening.
4. Generally speaking, more men were engaged in managerial positions in 1987 than women in New York this year.
5. As an overall trend, the number of crimes reported increased fairly rapidly until the mid-seventies, remained constant for five years, and finally dropped to 20 cases a week after 1982.
6. At first glance, it is clear that a greater percentage of native university pupils violated regulations and rules than the foreign students did during this period.
7. At the onset, it is clear that drinking in public and drink-driving were the most common reasons for US citizens to be arrested in 2014.
8. Overall, the leisure hours enjoyed by males, regardless of their employment status, were much higher than those of women.
The structure of the IELTS Academic Writing Task 1 (Report Writing):
Introduction:
Introduction (never copy word for word from the question) + Overview/ General trend (what the diagrams indicate at a first glance).
Reporting Details:
Main features in the Details
+ Comparison and Contrast of the data. (Do not give all the figures.)
+ Most striking features of the graph.
Conclusion:
Conclusion (General statement + Implications, significant comments)
[The conclusion part is optional.]
Tips:
1. Write the introduction and the General trend in the same paragraph. Some students prefer to write the ‘General Trend’ in a separate paragraph, and many teachers suggest that both be written in a single paragraph. Unless you have a really good reason to write the general trend in the second paragraph, try to write them both in the first paragraph. However, this is just a suggestion, not a requirement.
2. Your ‘Introduction (general statement + overall trend/ general trend) should have 75 – 80 words.
3. DO NOT give numbers, percentages or quantities in your general trend. Rather, give the most striking feature of the graph that could be easily understood at a glance. Thus, it is suggested to AVOID –
“A glance at the graphs reveals that 70% of the males were employed in 2001, while 40 thousand women in this year had jobs.”
And use a format /comparison like the following:
“A glance at the graphs reveals that more men were employed than their female counterparts in 2001, and almost two-thirds of females were jobless in the same year. “
Vocabulary to Start the Report Body:
Just after you finish writing your ‘Introduction’ (i.e. General Statement + General overview/ trend), you are expected to start a new paragraph to describe the main features of the diagrams. This second paragraph is called the ‘Body Paragraph / Report Body”. You can have a single body paragraph/ report body or up to 3 (not more than 3 in any case), depending on the number of graphs provided in the question and the type of these graphs. There are certain phrases you can use to start your body paragraph, and the following is a list of such phrases —
1. As it is presented in the diagram(s)/ graph(s)/ pie chart(s)/ table…
2. As (it is) shown in the illustration…
3. As can be seen in the…
4. As the diagrams suggest…
5. According to the…
6. Categorically speaking…
7. Getting back to the details…
8. Now, turning to the details…
9. The table data clearly shows that…
10. The diagram reveals that…
11. The data suggest that…
12. The graph gives the figure…
13. It is interesting to note that…
14. It is apparently seen that…
15. It is conspicuous that…
16. It is explicitly observed that…
17. It is obvious…
18. It is clear from the data…
19. It is worth noticing that…
20. It is crystal clear/ lucid that…
21. It can be clearly observed that…
22. It could be plainly viewed that…
23. It could be noticed that…
24. We can see that…
Vocabulary to show the changes:
| Trends | Verb form | Noun Form |
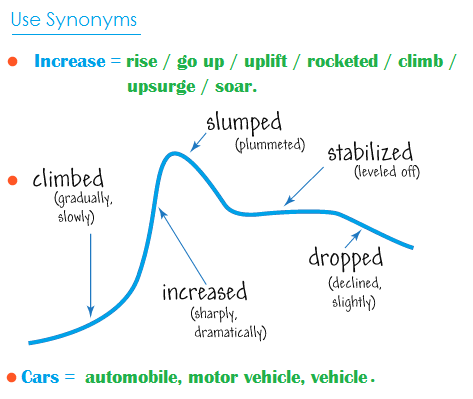
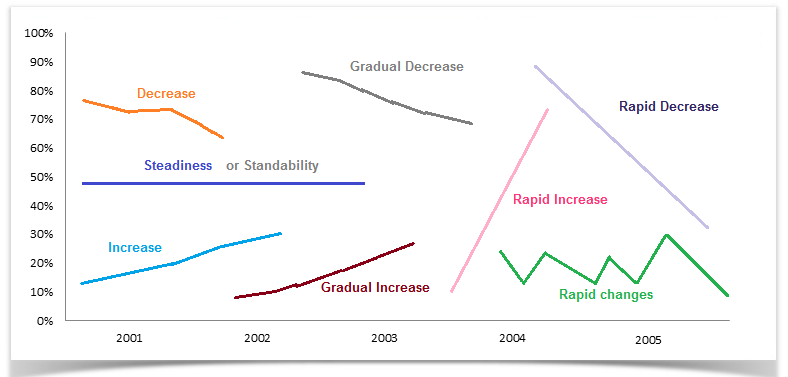
| Increase | rise / increase / go up / uplift / rocket(ed) / climb / upsurge / soar/ shot up/ improve/ jump/ leap/ move upward/ skyrocket/ soar/ surge. | a rise / an increase / an upward trend / a growth / a leap / a jump / an improvement/ a climb. |
| Decrease | fall / decrease / decline / plummet / plunge / drop / reduce / collapse / deteriorate / dip / dive / go down / take a nosedive / slum / slide / go into free-fall. | a fall / a decrease / a reduction / a downward trend/a downward tendency / a decline/ a drop / a slide / a collapse / a downfall. |
| Steadiness | unchanged / level out / remain constant / remain steady / plateau / remain the same / remain stable / remain static | a steadiness/ a plateau / a stability/ a static |
| Gradual increase |
———— |
an upward trend / an upward tendency / a ceiling trend |
| Gradual decrease |
———— |
a downward trend / a downward tendency / a descending trend |
| Standability/ Flat | level(ed) off / remain(ed) constant / remain(ed) unchanged / remain(ed) stable / prevail(ed) consistency / plateaued / reach(ed) a plateau / stay(ed) uniform /immutable / level(ed) out/ stabilise/ remain(ed) the same. | No change, a flat, a plateau. |
Examples:
1. The overall sales of the company increased by 20% at the end of the year.
2. The expenditure of the office remained constant for the last 6 months, but the profit rose by almost 25%.
3. There was a 15% drop in the ratio of student enrollment at this University.
4. The population of the country remained almost the same as it was 2 years ago.
5. The population of these two cities has increased significantly over the last two decades, and it is expected that it will remain stable during the next 5 years.
Tips:
1. Use ‘improve’ / ‘an improvement’ to describe a situation like economic condition or employment status. To denote numbers, use other verbs/nouns like increase.
2. Do not use the same word/ phrase over and over again. In fact, you should not use a noun or verb form to describe a trend/change more than twice; once is better!
3. To achieve a high band score, you need to use a variety of vocabulary as well as sentence formations.
Vocabulary to represent changes in graphs:
| Type of Change | Adverb form | Adjective form |
| Rapid change | dramatically / rapidly / sharply / quickly / hurriedly / speedily / swiftly / significantly/ considerably / substantially / noticeably. | dramatic / rapid / sharp / quick / hurried / speedy / swift / significant / considerable / substantial / noticeable. |
| Moderate change | moderately / gradually / progressively / sequentially. | moderate / gradual / progressive / sequential. |
| Steady change | steadily/ ceaselessly. | steady/ ceaseless. |
| Slight change | slightly / slowly / mildly / tediously. | slight / slow / mild / tedious. |
Example:
1. The economic inflation of the country increased sharply by 20% in 2008.
2. There was a sharp drop in industrial production in the year 2009.
3. The demand for new houses dramatically increased in 2002.
4. The population of the country dramatically increased in the last decade.
5. The price of oil moderately increased during the last quarter, but as a consequence, the price of daily necessities rapidly went up.
Vocabulary to represent frequent changes in graphs:
| Type of Change | Verb form | Noun form |
| Rapid ups and downs | wave / fluctuate / oscillate / vacillate / palpitate | waves / fluctuations / oscillations / vacillations / palpitations |
Example:
1. The price of the goods fluctuated during the first three months of 2017.
2. The graph shows the oscillations of the price from 1998 to 2002.
3. The passenger number in this station oscillates throughout the day, and in the early morning and evening, it remains busy.
4. The changes in car production in Japan show a palpitation for the second quarter of the year.
5. The number of students in debate clubs fluctuated in different months of the year, and rapid ups and downs could be observed in the last three months of this year.
Tips:
1. 4. DO NOT try to present every single piece of data presented in a graph. Rather, pick 5-7 most significant and important trends/ changes and show their comparisons and contrasts.
2. The question asks you to write a report and summarise the data presented in graphs(s). This is why you need to show the comparisons, contrasts, show the highest and lowest points and the most striking features in your answer, not every piece of data presented in the diagram(s).
Types of Changes/ Differences and Vocabulary to present them:
Great change / Huge difference:
Adjectives Adverbs
Overwhelming Overwhelmingly
Substantial Substantially
Enormous Enormously
Big change / Big difference:
Adjectives Adverbs
Significant Significantly
Considerable Considerably
Medium change / Moderate difference:
Adjectives Adverbs
Somewhat Somewhat
Moderate Moderately
Minor change / Small difference:
Adjectives Adverbs
Fractional Fractionally
Marginal Marginally
Slight Slightly
Dates, Months & Years related vocabulary and grammar:
» From 1990 to 2000; Commencing from 1980; Between 1995 and 2005; After 2012.
» By 1995; In 1998; In February; Over the period; During the period; During 2011.
» In the first half of the year; For the first quarter; The last quarter of the year; During the first decade.
» In the 80s; In the 1980s; During the next 6 months; In the mid-70s; Next 10 years; Previous year; Next year; Between 1980 – 1990.
» Within a time span of ten years; Within five years.
» Next month; Next quarter; Next year; Previous month; Previous year.
» Since; Then; From.
Percentage, Portion and Numbers:
Percentages:
10% increase, 25 percent decrease, increased by 15%, dropped by 10 per cent, fell by 50%, reached 75%, tripled, doubled, one-fourth, three-quarters, half, double fold, treble, 5 times higher, 3 times lower, declined to about 49%, stood exactly at 43%.
Fractions:
4% = A tiny fraction.
24% = Almost a quarter.
25% Exactly a quarter.
26% = Roughly one quarter.
32% Nearly one-third, nearly a third.
49% = Around a half, just under a half.
50% Exactly a half.
51% = Just over a half.
73% = Nearly three-quarters.
77% = Approximately three-quarters, more than three-quarters.
79% = Well over three-quarters.
Proportions:
2% = A tiny portion, a very small proportion.
4% = An insignificant minority, an insignificant proportion.
16% = A small minority, a small portion.
70% = A large proportion.
72% = A significant majority, A significant proportion.89% = A very large proportion.
89% = A very large proportion.
Words/ Phrases of Approximation – Vocabulary:
» Approximately
» Nearly
» Roughly
» Almost
» About
» Around
» More or less
» Just over
» Just under
» Just around
» Just about
» Just below
» A little more than
» A little less than.
What criteria would a band 9 graph response satisfy?
Task Achievement:
A) Fully satisfies all the requirements of the task.
B) Clearly presents a fully developed response.
What will be assessed by the examiner?
a) How appropriately, accurately and relevantly you fulfil your task requirements.
b) How accurately you write your report and how appropriately you present the data (compare/ contrast/ show the most striking trends/ features/ data.)
Coherence and Cohesion:
A) Uses cohesion in such a way that it attracts no attention.
B) Skillfully manages “paragraphing”.
What will be assessed by the examiner?
a) No misinterpretation and presentation of data and trends.
b) How well you organise your paragraphs.
c) Overall clarity and fluency of your report and message.
d) How well you have organised and liked the information, data and ideas in your writing.
e) Logical sequencing and appropriate use of linking devices between and within your sentences.
Tips:
1. Do not incorporate more than 3-4 paragraphs.
2. Do not use a single paragraph to describe everything.
3. The conclusion part is optional. If you think that you have already written more than 170 words and have nothing to say, you can skip the conclusion.
Lexical Resource:
A) Uses a wide range of vocabulary with very natural and sophisticated control of lexical features.
B) Rare minor errors occur only as “slips”.
What will be assessed by the examiner?
a) The range of vocabulary you have used in your writing.
b) How accurately and appropriately you have used words/ phrases while presenting the graph(s) as a report.
Tips: Do NOT use words/ phrases that are already given in the question. Do so only if there is no alternative word(s)/ phrase(s) to convey the same meaning/idea.

Grammatical Range and Accuracy:
A) Uses a wide range of structures with full flexibility and accuracy.
B) Rare minor errors occur only as “slips”.
Tips:
Do not use the same sentence structure and data comparison/ contrasting style over and over again. Bring a variety in your writing to show that you can formulate different sentence structures without making any grammatical mistakes.
I love your lesson. Thank you.
I love your lessons. Thank you.
Add me on WhatsApp. My WhatsApp number is +880 1710462699.
If so, why don’t you call me?
[quote name=”Aditya”]I am also looking for someone with whom I could practice speaking. If you wish, we can help each other.[/quote]Hey, I have been looking for an IELTS study partner. If it’s okay with you, we could practice some of the skills. Let me know your answer.
Useful.
I am also looking for someone with whom I could practice speaking. If you wish, we can help each other.
I am also willing to find someone whom I can practice with. Kindly send me your contact where we can get familiar with each module.
If you need a partner to build up skills, I can help.
I also need someone to practice speaking and improve my knowledge and vocabulary.
You can email me.
I really need to improve my grammar problem in writing. What do I do?
I also need an IELTS speaking partner.
Hey! I need a partner for IELTS speaking practice. Is there anyone to help me in this?
Hey! I really need a partner for IELTS speaking.
Hello, my exam is on 12th August.
Hey, I would love to practice with you. I am taking IELTS in August. Please contact me on Skype – prasunranjit30. Thank you.
Hello, Hann. I am also taking IELTS next month. Let’s add on Skype – prasunranjit30. We will practice there.
Have you done your IELTS exam?
I really need to improve my English level but I have grammatical problems in writing and speaking. What do I do?
Hi, such a useful basic knowledge for my IELTS. Thanks, http://www.ielts-mentor.com, thanks…
Ping me on 8608718549 for IELTS preparation partner.
Well, I am planning to take IELTS exam on 26th August. So I eagerly want to enhance my speaking skill. If any of you guys are interested, then please contact me. My Skype id is abhirajbasnet11.
My IELTS test is near. Can anyone please give me some tips to improve my reading band score?
Hi, I have scored 5.5 in writing. What should I improve to get better than this? Regards.
Awesome… Very good connectors are available here. Thank you sooo much.
Hi, how could we practice?
Tomorrow, good luck!
Hi Darin, I’ll take my IELTS exam this August too. Can we practice together? I need someone to improve my English speaking, the time is coming closer and closer. Feel free to contact me via Skype: anderson_254.
The format for writing task 1: Introduction+ overview+explanation. Is it corr4ect according to the Cambridge University recommendation?
[quote name=”Monika Shrestha”]Help me to learn and speak English.[/quote][quote name=”Monika Shrestha”]Help me to learn and speak English.[/quote] Message me anytime. It’s my pleasure. I will help you.
Hi, there, I will take IELTS in this August. I would like to find some English friends/ anyone to practice speaking with me. I have already appeared more than 7 times and in every time, I have got 5.5 band score. I am not sure what was my actual fault. I believe this is the correct platform to learn proper English. If anyone can help, please, feel free to contact me. Thanks – Ranit.
How many points did you score? (If it is not a secret)
Hi. I’m interested in practising with you. My IELTS exam is knocking at the door. I have already taken IELTS on last June 2017. But now I’m taking UKVI on July 29. Email me if you are interested. My email address is sany.chowdhury12@gmail.com.
I can help you.
Good.
I’m giving my IELTS exam on 20th July… This is a helpful website.
Hey!! anyone reading this… I will be very thankful if anyone steps forward to do speaking practice with me. I think I can even help anyone who wants. Well my email is yudhveervirk212@gmail.com
Hello, everyone. I’m looking for a partner to practice my speaking. Is there anyone available?
Hey, Monika, I can help you in speaking though I have already appeared in IELTS exam.
I’m very interested for that.
I too want to practise IELTS speaking sessions.
[quote name=”Monika Shrestha”]Help me to learn and speak English.[/quote]We have just need to create a speaking environment. If you have Skype then contact me. My Skype id is ‘sufyan.shahid75’ & WhatsApp number is 0334 8613657.
I would like to help you, Monika 🙂
Help me to learn and speak English.
I am also taking the IETLS test on 8th of July. Can we practice together? Email me for that. My email id is shahbazrazzaq679@yahoo.com
Hi, I am also taking IELTS. Could we do practice together on Facebook?
Have you finished your IELTS exam? I need your assistance and I am gonna appear IELTS on 10th July.
Unluckily, I don’t use Kakaotalk or Skype T.T. Do you have a Facebook account or anything else?
Help me in learning English.