IELTS Academic Writing Task 1/ Graph Writing – Bar/Column Graph:
You should spend about 20 minutes on this task.
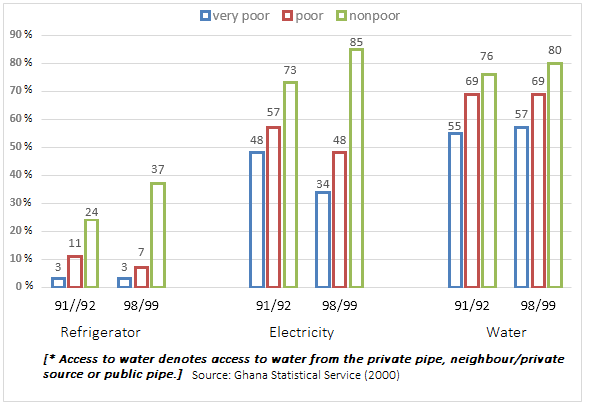
The graph below shows the percentage of households, grouped by poverty, on the basis of access to refrigerator, electricity and water in Ghana for the year 1991/1992 to 1998/1999.
Summarise the information by selecting and reporting the main features, and make comparisons where relevant.
You should write at least 150 words.
Model Answer 1:
The bar chart illustrates the proportion of Ghanaian households, classified by poverty status, that had access to electricity, refrigerators, and water in 1991/1992 compared with 1998/1999.
Overall, non-poor households enjoyed far greater access to all three basic amenities than very poor or poor families, while in some cases, access for the lower-income groups actually declined over the period.
In the early 1990s, only about 3% of the very poor had refrigerators, even though nearly 48% of them were connected to electricity. Interestingly, by 1998/99, that figure fell sharply to around 34%. Water access for this group was more promising as it increased modestly from roughly 55% to 57%.
Among the “poor” category (just above the very poor), refrigerator access dropped from 11% to 7% over time. Their electricity connection also deteriorated slightly, but water access remained stable at roughly 69% throughout the period.
In contrast, non-poor or affluent households made clear gains. Access to electricity rose from around 73% to 85% in seven years, while their water access also increased slightly. Refrigerator ownership among this wealthier group likewise improved over time, reflecting a widening inequality. As the rich gained more in terms of basic utilities, the poorest either stagnated or lost ground in certain areas.
Sample Answer 2:
The diagram outlines how the electricity, refrigerator and water access to Ghanaians changed in 9198-99 compared with that of 1991-92. The data was published by the Ghana Statistics Service in 2000, and access to these conveniences is categorised based on the economic conditions of Ghanaians.
It is evident that solvent people had far better access to these facilities, while the availability of electricity and fridges deteriorated for poor Ghanaians.
As the bar graph suggests, only 3% poor citizens in Ghana had access to refrigerators in 1991/1992, despite 48% of them having electricity. Access to electrical energy for the very poor declined by 14% after 7 years. However, water access was granted for over half of the scanty people in 91/92 fiscal year, while it slightly improved afterwards.
Poor Ghanaians’ access to electricity was somewhat better than very poor citizens, but in 7 years the scenario deteriorated. Their access to refrigerators was 11% in 1991/92, which reduced by 5% in 1998/99. Moreover, around seven in ten poor citizens received water facilities, which remained constant in 98/99.
Finally, affluent Ghanaians had better access to these amenities as 85% of them had electric power in 1998/99 compared to 34% destitute Ghanaians access to this facility. Eight out of ten rich people had access to water, and their access to these resources increased over the period, unlike poor citizens.