IELTS Academic Writing Task 1/ Graph Writing – Pie Charts:
You should spend about 20 minutes on this task.
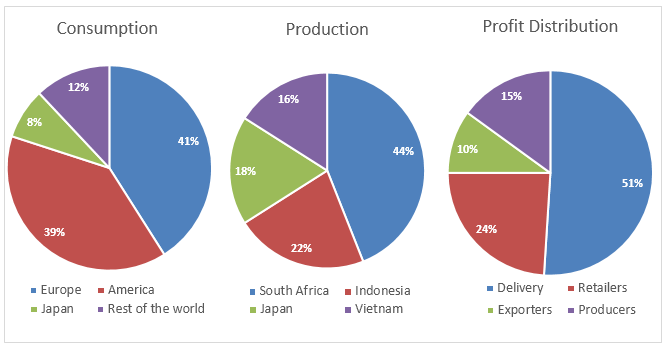
The pie charts below show the coffee production, coffee consumption and the profit distribution around the world.
Summarise the information by selecting and reporting the main features, and make comparisons where relevant.
You should write at least 150 words.
Model Answer 1:
The three pie charts illustrate global coffee production by country, coffee consumption by region, and the distribution of profits across various segments of the coffee industry.
Overall, coffee consumption is dominated by Europe and America, production is heavily concentrated in South Africa, and the largest share of profits goes to the delivery sector.
In terms of global coffee consumption, Europe accounts for the largest share at around 41%, closely followed by America at 39%, while Japan has the smallest share at 8%, and the rest of the world makes up the remaining 12%. On the production side, South Africa contributes a striking 44% of the global coffee output, which is precisely double Indonesia’s 22%. Japan and Vietnam also produce substantial amounts, at 18% and 16% respectively.
Regarding profit distribution in the coffee industry, the delivery companies claim the major share with 51% of the profits. Retailers earn about 24%, while producers and exporters receive 15% and 10% respectively.
Sample Answer 2:
The pie charts show global coffee consumption, coffee production in four countries, as well as profit distributions among business segments related to coffee. It is obvious that Europeans and Americans are the primary coffee consumers, while South Africa is the largest coffee producer among the given countries. Moreover, companies that deliver coffee make more profit than other organisations that do business in this industry.
According to the illustration, Europeans alone consume more than 40% of global coffee, which is the highest ratio of coffee intake in the world. America consumes 2% less than that, while Japan dissipates only 8% of the global coffee. The rest of the world consumes only 12% coffee.
When it comes to the ratio of global coffee production, South Africa contributes 44%, which is the highest in the world. Indonesia harvests 22% coffee, exactly half of the South African coffee assembly. Japan and Vietnam make 18% and 16% coffee, respectively. Interestingly, despite Japan’s being one of the top countries to produce coffee, its consumption ratio is comparatively lower. Finally, more than half of the profit from coffee is made by the delivery industries. Coffee retailers’ share of profit is roughly a quarter, while coffee producers and exporters make 10% and 15% profits, respectively.
Sample Answer 3:
The three pie charts present information about global coffee production, consumption and profit from numerous coffee-related businesses.
Overall, Europeans and Americans consume the highest amount of coffee, while South Africa is the biggest producer. Additionally, the coffee delivery service is the most profitable business among those compared.
In detail, Europeans and Americans consume coffee four times as much as the rest of the world. Japan, whose production accounts for 18% internationally, only consume a mere 8% of global coffee.
It is worth noticing that South Africa produces 44% of the coffee (more than anywhere else), which is exactly double that of the coffee production in Indonesia – a country that grows the second-largest coffee. Along with South Africa, Indonesia and Japan, Vietnam also harvests coffee, and the ratio is 16% of total global production.
Regarding profit distribution, it can be seen that more than half of it goes to the coffee delivery industry. Retailers get approximately a quarter, while the figure for coffee producers’ profit is only 15 per cent. The remaining 10 per cent is what exporters receive.
[Written by – Nguyen Thuong Vu]
There are some grammatical errors. In the following lines – (Interestingly, Japan…)
No, there are not.
Can we explain this graph in past tense?
If there is no year given.