IELTS Academic Writing Task 1/ Graph Writing – Pie Chart:
You should spend about 20 minutes on this task.
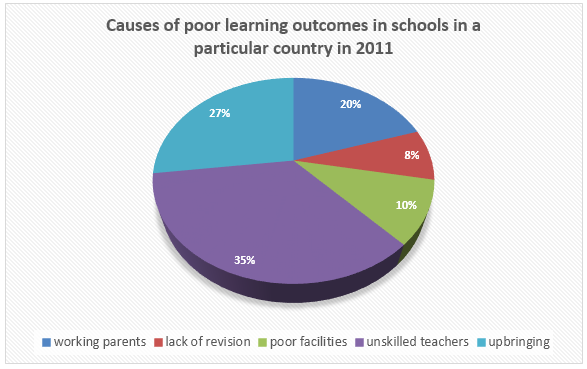
The pie chart below shows the results of a survey of the causes of poor learning outcomes in schools in a particular country in 2011.
Summarise the information by selecting and reporting the main features, and make comparisons where relevant.
You should write at least 150 words.
Model Answer 1:
The pie chart presents a survey result that outlines why pupils in schools performed poorly in a country in 2011. Categorically speaking, inexperienced teachers and family issues were the primary reasons for their poor learning outcomes.
In short, unskilled educators, family issues – like working parents, improper upbringing or children – insufficient facilities and lack of study and revision were the main reasons schoolgoers’ learning, in this country, was not up to the mark.
As the data suggests, unskilled masters in schools were the primary ground for young students’ inadequate performance, as 35% attribution was made to unskilled teachers. The second most prominent reason, denoted as 27%, was indicated towards the upbringing of the children, which is related to the family issue. Working-class parents were attributed to influence students’ learning negatively as 20% of poor learning results were linked to the bad performance of pupils in schools. Inadequate facilities and lack of revision were pointed out to cause 10 and 8 percentages of this unsatisfactory performance based on the outcomes of the survey.
Model Answer 2:
The pie chart outlines the results of a survey about the perceived causes of poor learning outcomes in schools in a country in 2011.
Overall, more than half of the respondents attributed poor learning outcomes to issues related to unskilled teachers and family background. Less important, though still relevant, were factors such as lack of school facilities and insufficient revision.
According to the chart, the largest cause of unsatisfactory performance of students, according to the participants of a survey, was due to the lack of skilled teachers. One out of three responders attributed unskilled teachers to the poor performance of learners in this survey. The second major cause, according to them, was family issues or the upbringing of children. In addition, 20% of respondents pointed to “working parents” (i.e. parents being too busy, probably unable to support their children’s learning) as a reason.
Less frequently cited causes were inadequate facilities, accounting for 10%, and lack of revision or poor study and revision habits, at 8% that were also mentioned in this survey as the cause of students’ poor learning outcomes.
Sample Answer 3:
The pie graph illustrates why students in a country had substandard results in the year 2011. Overall, there were five main reasons, and unskilled teachers were to take the most blame.
As the diagram suggests, 35% of students did not have good learning outcomes because of some teachers’ lack of experience. On the other hand, family issues accounted for the second-highest percentage of poor learning in school, which was slightly over a quarter. Additionally, precisely one-fifth of students’ poor learning had been due to working parents.
The figure regarding inadequate facilities stood at 10%, which was slightly higher than that when it came to students’ revision problems. It is worth noticing that there was a difference of 27% between the most common cause – unskilled teachers, and the least – lack of revision. Besides, the former was more than four times when compared with the latter.
Finally, the two main reasons made up more than 60% of poor learning problems, while the least popular two reasons only represented less than 20%.
[Written by – Nguyen Thuong Vu]
The tense must be in the past for this pie chart. A lot of fancy words that do not make sense in the context used. Lack of comparison…