IELTS Academic Writing Task 1/ Graph Writing – Line Graph:
You should spend about 20 minutes on this task.
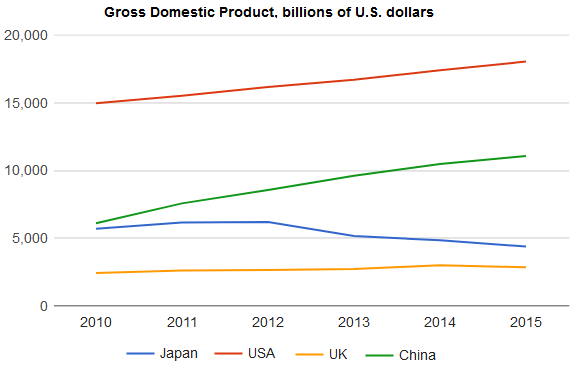
The graph below shows the Gross Domestic Product (GDP) in four selected countries between 2010 and 2015.
Summarize the information by selecting and reporting the main features, and make comparisons where relevant.
You should write at least 150 words.
Sample Answer 1:
The line graph compares the Gross Domestic Product (GDP) in four countries and delineates how GDP in these countries changed between 2010 and 2015. The GDP is measured in USD (in billions of dollars). As can be seen, the USA had the largest GDP, and in China, the GDP growth was remarkable.
The diagram outlines that the USA had the highest GDP in 2010, which was exactly fifteen thousand billion dollars. With roughly six thousand billion USD, China had the second largest GDP, while Japan almost reached the GDP of China this year. The UK had the lowest GDP in 2010, which was somewhat two thousand and five hundred billion USD.
It is worth noticing that GDP in the USA steadily grew and reached over 1,8000 billion dollars in 2015, 3000 billion dollars higher than that of 2010. The USA’s GDP was higher than that of any other country between 2010 and 2015. However, the GDP growth in China was most remarkable as it almost doubled in 5 years, reaching almost 12,000 billion USD in 2015. As an exception, GDP in Japan actually declined while it remained almost the same in the UK over the five years.
Model Answer 2:
The line graph compares the Gross Domestic Product (GDP) of the USA, China, Japan and the UK from 2010 to 2015. The figures, expressed in billions of US dollars, show distinct trends for each country over the six years.
Overall, the United States maintained the highest GDP throughout the period, and China experienced the most significant growth. In contrast, Japan’s GDP declined overall, while the UK saw only modest increases.
In 2010, the US started with the largest economy at about 15,000 billion dollars, and this expanded steadily to roughly 18,000 billion dollars by 2015. China’s GDP showed remarkable growth: it began at around 6,000 billion dollars and climbed consistently each year, reaching approximately 12,000 billion dollars in 2015, doubling over the period.
Japan’s GDP, which was close to 6,000 billion dollars in 2010, remained fairly stable until 2012 but then entered a downward trend, falling to just over 4,000 billion dollars by 2015. The UK, by contrast, had the smallest GDP among the four countries but recorded slight overall growth. Starting at around 2,500 billion dollars in 2010, it rose gradually to a peak of about 3,000 billion dollars in 2014 before dipping slightly in the final year.