IELTS Academic Writing Task 1/ Graph Writing – Bar Graph + Table:
You should spend about 20 minutes on this task.
The graphs below show the global robotics market during 2000 and 2025 based on sectors.
Summarise the information by selecting and reporting the main features, and make comparisons where relevant.
You should write at least 150 words.
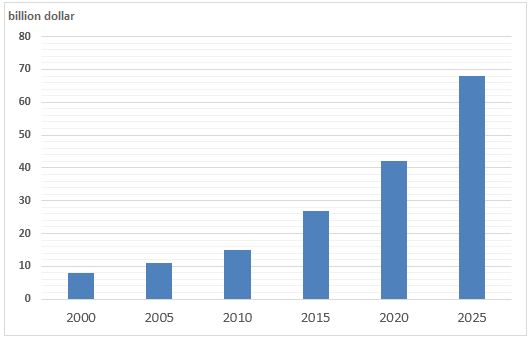
Size of the global robotics market 2000-2025 (billion US dollars)
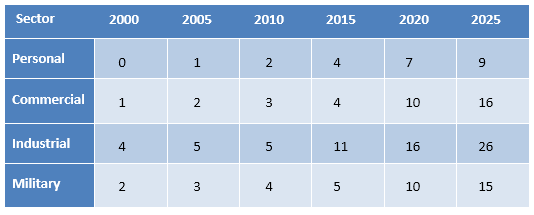
Size of global robotics market by sector 2000-2025 (billion US dollars)
Model Answer 1:
The bar chart and accompanying table illustrate the value of the global robotics market from 2000 to 2025, broken down by four sectors: industrial, commercial, personal, and military. Figures are given in billions of US dollars.
Overall, the global robotics market increased significantly during the period. Among the four sectors, industrial robotics consistently dominated, while personal and commercial robotics, despite being negligible at the start, showed the most dramatic relative growth.
In 2000, the total robotics market was relatively small, at just under 10 billion US dollars, with industrial and military sectors each contributing 4 and 2 billion dollars, respectively. The personal robotics sector was virtually non-existent, and the commercial sector generated just 2 billion dollars. By 2010, the market value more than doubled, with industrial robotics rising to approximately 5 billion, and the other three sectors also increasing to between 2 and 4 billion. The market share of robotics in all these sectors followed the same growing trend in 2020, at which point the personal and military sectors of robotics expanded to 10 billion dollars, while it was 6 billion dollars higher for the industrial sector. Finally, in 2025, the industrial sector dominated the market with 26 billion dollars, followed by the commercial (16 billion), military (15 billion) and personal (9 billion) sectors.
Sample Answer 2:
The diagrams show data on the global market of robotics in US billion dollars from 2000 to 2025. Overall, the robotics market significantly progressed over time, especially in recent years, and its industrial, commercial and military usages are predominant.
According to the bar chart, the global robotics market in 2000 was less than 10 billion US dollars, and during the next decade, it almost tripled. Its market grew remarkably and passed 40 billion dollars in 2020. Finally, in 2025, this jumped to approximately $70 billion, almost an eightfold increase in just two and a half decades.
As the table data suggests, personal use of robotics was not available in 2000, but started in 2005. It reached $4 billion in 2015 and grew as high as 9 billion dollars in 2025. Commercial use of robotics also grew and expanded to $16 billion in 2025, compared to just 4 billion a decade earlier. In 2025, industrial use of robotics was the highest – $26 billion to be exact. Finally, the military use of this technology was just US $2 billion in 2000, and it exceeded 15 billion dollars in 2025.
The supplied graphs compare the international robotics market since 2000 with anticipation until 2025 and divide the size of the market into 4 sectors (measurements are in billion dollars).
As can be seen, the robotics market will significantly experience advancement, especially in the anticipated future, while industrial use will be the leading market.
As the graph suggests, the international market for robotics in 2000 was less than 10 billion. In the next decade, this number almost trebled and ultimately ended above 40 billion in 2020. This growth will highly likely continue to surge by almost 70 billion by 2025.
As the table noted, personal use of robotics was fully ignored in 2000, but it doubled in the next decade and finally will hit the 9 billion dollars market by the year 2025. The commercial sector with 3 billion more than personal use in 2020, held 10 billion dollars in the market and will rocket to 16 billion in the future. In addition, the military started with 2 billion on the table and managed to reach 10 billion until now it is expected that this trend will peak to 15 billion. Ultimately, the industrial market with 5 billion in the first decade won the chart in 2010 and will be predominant till 2025 among all sectors.