IELTS Academic Writing Task 1/ Graph Writing – Pie Chart + Bar Graph:
» You should spend about 20 minutes on this task.
The graph and the pie chart below give information on in-house training courses in a large financial company.
Summarise the information by selecting and reporting the main features, and make comparisons where relevant.
You should write at least 150 words.

Office Worker’s Attitude to Training (%)
Model Answer 1:
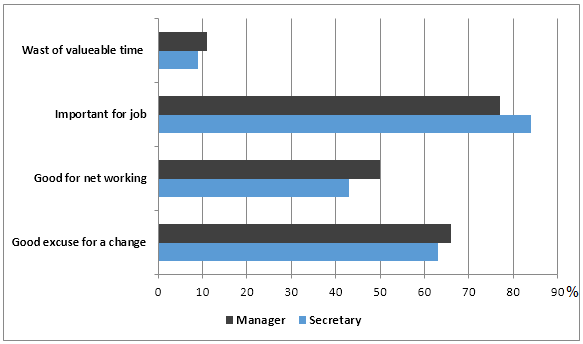
The pie chart and bar chart present information about in-house training courses in a large financial company. The pie chart shows how annual training hours are distributed among four types of courses, while the bar chart compares how managers and secretaries perceive these training programmes.
Overall, the company allocates the greatest proportion of training time to technical skills, whereas health and safety receive minimal attention. In addition, attitudes towards training are largely positive among both employee groups, with only a small minority viewing it negatively.
In terms of time allocation, technical training dominates the programme, accounting for 30 hours per year, which is more than all other categories individually. Career development follows at 15 hours, while interpersonal skills training is allotted 10 hours annually. By contrast, only 5 hours are devoted to health and safety, making it the least emphasised area of training.
Employee perceptions further highlight the value placed on these courses. A substantial majority of both groups regard training as important for their job, with approximately 77% of managers and just over 80% of secretaries expressing this view. Training is also seen as a welcome break from routine by more than 60% of respondents in each group. Only around one in ten employees from either group considers the training a waste of time.
Sample Answer 2:
The pie chart shows the annual duration of four different in-house professional training sessions in a large company, while the bar graph outlines what managers and secretaries think about those training sessions.
Overall, the duration of technical training is higher than other types of training, and most managers and secretaries of this company opine that these training sessions are important for their jobs.
According to the illustration, the annual duration of technical training is 30 hours, which is exactly double and treble than that of career and interpersonal skills development training, respectively. Health and safety-related sessions have the least duration, 5 hours per year.
The bar graph reveals that more than 80% secretaries and roughly 77% managers find these training sessions helpful for their jobs. One out of ten employees does not take those training sessions positively, as they think it is waster of time. Half of the managers and over 40% secretaries consider the training to be an opportunity to expand their network. Finally, roughly six out of ten also feel that these training sessions bring good excuses for a change.