IELTS Academic Writing Task 1/ Graph Writing – Pie chart + Bar graph:
You should spend about 20 minutes on this task.
The Charts below give information on the location and types of dance classes young people in a town in Australia are currently attending.
Summarise the information by selecting and reporting the main features, and make comparisons where relevant.
Write at least 150 words.
Location of dance classes

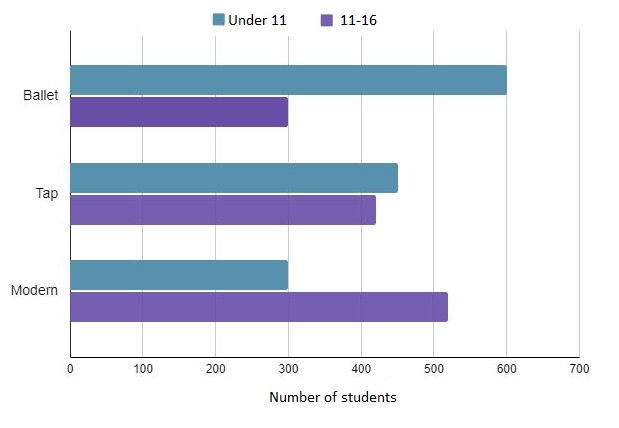
Types of dance classes (by age group)
Model Answer:
The pie chart shows the proportion of dance classes in different venues, while the bar chart illustrates the number of young people, by age group, participating in various dance styles in a town in Australia.
Overall, private studios are by far the most common location for dance classes by young people in a town in Australia. Moreover, ballet is especially favoured by the youngest age group, and modern dance is most popular among older children.
According to the first chart, nearly half of the total dance classes are held in private studios, making it the predominant venue for young people in a town in Australia. After-school classes in school halls account for around one-quarter of all venues, while community halls and other types of venues host about 18% of dance classes. College‑based studios are the least used, representing only 10% of all dance class locations.
Turning to the second chart, ballet dominates among children under 11, with approximately 600 attendees in that age bracket, which is double the number of 11 to 16‑year-olds who take ballet. In contrast, modern dance attracts more of the older group – about 520 participants aged 11 to 16, compared to just 300 under‑11s. Finally, tap dance shows a fairly balanced distribution, with roughly 440 children under 11 and 420 in the 11-16 age group.