IELTS Academic Writing Task 1/ Graph Writing – Line Graph:
You should spend about 20 minutes on this task.
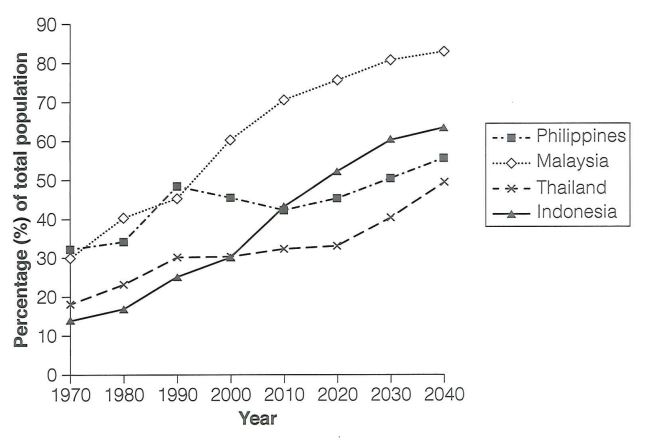
The graph below gives information about the percentage of the population in four Asian countries living in cities from 1970 to 2020, with predictions for 2030 and 2040.
Summarise the information by selecting and reporting the main features, and make comparisons where relevant.
Write at least 150 words.
Percentage of population living in cities
Model Answer:
The line graph illustrates the proportion of people living in cities in four Asian countries from 1970 to 2020, along with predictions for 2030 and 2040.
Overall, in all four given counties, the ratio of city-dwellers rapidly increased over the period, and it is predicted to rise even further in the coming decades.
In 1970, both Malaysia and the Philippines had about 30 percent of their populations living in cities, whereas just under one-fifth of the population in Thailand lived in urban areas. Indonesia was the least urbanised in terms of its population ratio in cities, with roughly 12 to 13 per cent.
Over the next decades, Malaysia saw a rapid rise in its urban population ratio, and the figure reached approximately 75% in 2020. The forecasts suggest it will climb to around 85% by 2040, making it the most urbanised country among the four. Indonesia, on the other hand, expanded from its initial low base of city-dwellers to about 50% by 2020, when half of its total population will live in cities. It is expected to reach about 60% by 2040. The Philippines experienced a more volatile trend as its urban share of population rose to around 50% in 1990, then fell back in the following years, fluctuating until 2020 at roughly the mid‑40s. Predictions suggest a gradual rebound, bringing the figure closer to 60% by 2040. Finally, the ratio of city dwellers in Thailand was just 30% in 2020, and it is projected to reach a point where almost half of its population will live in city areas.