IELTS Academic Writing Task 1/ Graph Writing – Line Graph:
You should spend about 20 minutes on this task.
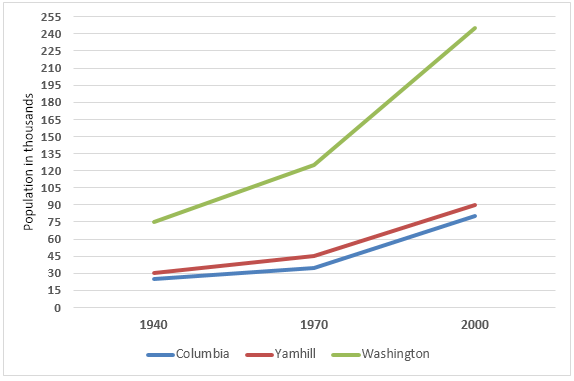
The graph below shows the population change between 1940 and 2000 in three different counties in the US state of Oregon.
Summarise the information by selecting and reporting the main features, and make comparisons where relevant.
You should write at least 150 words.
Population (in thousands) in the state of Oregon by County, 1970-2000.
Model Answer 1:
The line graph illustrates changes in population in three counties in Oregon (Columbia, Yamhill and Washington) between 1940 and 2000, with figures measured in thousands of residents.
Overall, Washington experienced by far the most dramatic growth in population, especially after 1970, and finished the period with a population much higher than the other two counties. By contrast, Columbia and Yamhill’s populations increased more gradually and remained relatively close to each other throughout the six decades.
In 1940, Washington was the most populous county among the three, with around 75,000 residents, while Yamhill and Columbia’s population stood lower, at roughly 30 thousand and 22 thousand, respectively. Over the next thirty years, Washington’s population rose steadily to nearly 125,000 by 1970, whereas Yamhill’s population climbed to approximately 50,000 and Columbia’s to just under 40,000.
From 1970 onwards, Washington’s population growth accelerated sharply. It surged to around 180,000 in 1980 and then continued rising rapidly, reaching over 240,000 by 2000. Meanwhile, Yamhill and Columbia followed much gentler upward trends: the population in Yamhill increased to about 90,000 by the end of the period, while Columbia grew more modestly to around 77,000.
Sample Answer 2:
The line graph compares how the population in three areas in the state of Oregon, USA, changed between 1940 and 2000. Overall, Washington had a far higher population than Columbia and Yamhill, and the population growth between 1980 and 2000 was considerably higher in these counties.
In 1940, the population of Columbia was around 28 thousand, the lowest among the three counties in the state of Oregon. This year, Yamhill had a population of 30 thousand, while Washington had 75 thousand inhabitants, the highest among these counties.
By 1970, Yamhill’s population increased by 50%, while Columbia witnessed about 40% population growth during the same period. At that time, Washington’s population reached nearly 125 thousand, almost 67% grwoth. Washington’s population in 1970 was somewhat double the population of Yamhill and Columbia combined.
Finally, in 2000, Columbia and Yamhill accommodated roughly 90 and 80 thousand citizens, a noticeable growth from that of the last three decades. This year, Washington’s population reached approximately 250 thousand, more than double that of the 1970s.