IELTS Academic Writing Task 1/ Graph Writing – Bar/Column Graph:
You should spend about 20 minutes on this task.
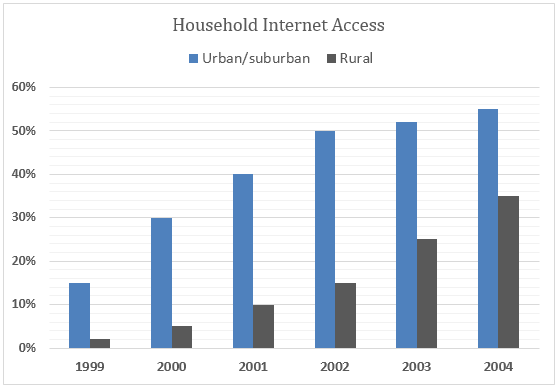
The graph below shows the percentage of urban/suburban and rural households in a European country that had Internet access between 1999 and 2004.
Summarise the information by selecting and reporting the main features, and make comparisons where relevant.
You should write at least 150 words.
Sample Answer 1:
The bar graph compares the percentages of city and rural households with internet access in a European country from 1999 to 2004.
Generally speaking, internet connectivity in rural households in this European country was less available than that of the city and suburban areas. Moreover, over time, internet accessibility in both of these areas enhanced remarkably.
In 1999, merely 2% rural households in this European country had access to the internet, while around 15% city dwellers had it. During the next year, one in twenty rural houses gained this access, while almost one-thirdof urban and suburban families were connected to the internet. In 2002, half of the city dwellers gained internet access, while it was as small as 15% for rural citizens. During the next two years (i.e. 2003 and 2004), the percentage of rural households that joined this network increased sharply, from 15% to 25% in 2003 and futher 10% in 2004. The ratio of households in urban and suburban areas with internet access rose to roughly 55%, a slower extension than that of rural households during the last three years. The ratio of homes, both in cities and rural areas, with access to the internet was quite negligible in 1999, but improved dramatically within the next 5 years.
Model Answer 2:
The column graph compares the percentages of urban/suburban and rural households in a European country that had access to the Internet between 1999 and 2004.
Overall, Internet access increased substantially in both areas over the period, but urban and suburban households consistently recorded much higher figures than rural ones. Although the gap remained clear throughout, rural communities experienced faster relative growth, particularly after 2001.
In 1999, only about 15% of urban/suburban households had Internet access, compared with a negligible 2% in rural areas. Over the next two years, both figures rose steadily. Urban/suburban access doubled to roughly 30% in 2000 and then climbed to around 40% by 2001. Rural penetration also increased, but more slowly in absolute terms, reaching approximately 5% in 2000 and 10% the following year.
From 2002 onwards, Internet usage expanded more rapidly, especially in the countryside. In urban/suburban areas, the proportion jumped to just above 50% in 2002 and then levelled off at around 55% in both 2003 and 2004. Rural households followed a steeper upward path during the same period, rising to about 15% in 2002, increasing further to roughly 25% in 2003, and finishing at approximately 35% by 2004.
The provided line chart compares the proportion of Internet usage between European city/outskirt and rural households from 1999 to 2004.
Overall, it can be seen that Internet usage in both areas had the tendency to surge throughout the period. Another explicit point is that the city/outskirt households had by far more Internet usage per cent than in the rural areas.
In 1999, the percentage of Internet usage in the urban/suburban area accounted for nearly 15%, while the figure for the rural area took up just a small portion, at which point, both figures doubled in per cent in 2000, the former constituted 30% while the latter accounted for 5% in 2000. In the next year, the percentage of Internet access in the city areas experienced a soar to 40%, while that of rural areas slightly increased to one in ten per cent.
In 2002, it can be witnessed that the proportion of Internet access in the urban/suburban area reached half, while that of the rural area consisted of 15%. In the last year of the survey, the figure for the urban/suburban area slightly aggregated to more than half, while the per cent of Internet access in the rural areas dramatically rocketed to more than one-third per cent (35%).