IELTS Academic Writing Task 1/ Graph Writing – Bar Chart / Column Graph:
You should spend about 20 minutes on this task.
The graph below shows the percentage sales of trainers made by a sportswear company in one year.
Summarize the information by selecting and reporting the main features, and make comparisons where relevant.
You should write at least 150 words.
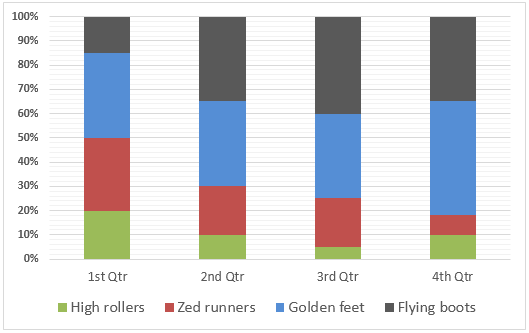
* The Flying Boots trainers were launched at the beginning of that year.
Model Answer 1:
The bar chart illustrates the proportion of total trainer sales for a footwear company by four different models over each quarter of a single year.
Overall, Golden Feet and Flying Boots trainers were the dominant products for this company, as they brought the highest volume of sales. High Rollers, on the other hand, consistently held the smallest share of sales volume, and its sales amount shrank each quarter.
In the first quarter, Golden Feet led sales with around 35%, followed by Zed Runners at about 30% and High Rollers at 20%. Flying Boots, which were launched at the start of the year, accounted for approximately 15% sales. In the second quarter, the company sold most footwear from the brand Flying Boots and Golden Feet (35% each), while High Rollers sales dropped to about 10% and Zed Runners declined to 20%.
This pattern continued into the third quarter, where Flying Boots emerged as the clear winner with approximately 40% sale volume. Golden Feet maintained its prominence, and the sales amount of Zed Runners remained almost the same. However, High Rollers fell further to around 5%, marking its lowest share. By the final quarter, Golden Feet emerged as the clear leader with about 44% of sales. Flying Boots held close behind, Zed Runners dipped to around 15%, and High Rollers recovered slightly to about 10%.
Sample Answer 2:
The column graph compares the sales volume of trainer shoes in a year manufactured by a company. Overall, Flying Boots, a trainer footwear type, that was launched at the start of the year, became popular while Golden Feet dominated the market share in terms of its sales ratio.
As can be seen, the sportswear company sold four types of trainer footwear throughout the year, and the first quarter was dominated by the Golden Feet and Zed Runner shoes as they each made approximately one-third of the total sales. The newly launched trainers, Flying Boots, brought around 15% businesses for this sportswear company in the first quarter of the year. During the second quarter, the sales proportion of Flying Boots increased to 32% while sales of Golden Feet made up one-third of the total. The sales amount of High Roller shrank considerably in the third quarter. However, during this time, the newly launched brand made the highest sales. With a declining sales ratio throughout the third quarter, Golden Feet’s demand rose in the last quarter of the year, while Flying Boots made the second largest sales. Interestingly, the other two trainer shoe models – High Rollers and Zed Runners – contributed to less than 20% sales to this company in the last quarter.
The given bar chart illustrates how a sportswear company sold four different types of trainers throughout a year. As can be seen, the products ‘Flying boots’ and ‘Golden feet’ were more popular than the remaining two – ‘Zed runners’ and ‘High rollers’.
To begin with, Flying boot trainers, which were launched right in the year’s first quarter, immediately represented 15% sales. Sales of Golden boots at the same time were more than double those of Flying boots and were the largest in that quarter. The popularity of Golden feet trainers remained the same in the next 6 months, before rising dramatically to almost 50% by the end of the year.
The figure regarding Flying boots went as high as 40% in the third quarter, before reducing by 5% three months later. As for the products Zed runners and High rollers, they accounted for a total of 50% in the first quarter, but by the end of the year, they represented just under one-fifth. It is worth noticing that after a year, sales of High rollers became exactly a half, while those of Zed runners saw a dramatic decline in the final quarter – down from 30% at the year’s beginning to less than 10% at the year’s ending.
The bar chart presents data regarding a sportswear company’s annual sales of four types of trainer shoes.
Overall, ‘Golden feet’ dominated the market throughout the year. However, ‘Flying Boots’ trainer, which was launched at the beginning of the year, gradually witnessed an increase in popularity.
In details, in the 1st quarter, the sale of shoes was dominated by Golden feet and Zed runners as roughly 30% and 35% of these types of footwears were chosen by the customers respectively. Flying boots, which debuted this year only, recorded 15% share of the total sales volume. However, this type of trainers slowly gained popularity over the year and recorded the highest sales in the 3rd quarter (approximately 40%).
Furthermore, although ‘High rollers’ was the third highest-selling product of the company in the 1st quarter, its demand significantly plunged in the following months and touched the lowest sale in the 3rd quarter (slightly more than 5%) before observing a nominal increase of 5% by the end of the year. A similar pattern could be observed for Zed runners. From being the second-most popular trainer shoes, it dropped to less than 10% in the final leg. Also, Golden feet’s demand increased significantly in the last quarter and this brand contributed roughly 50% of the total sales amount.
Note: It would be great if you kindly evaluate my essay. Thank you so much in advance.