IELTS Academic writing task 1 – Pie Chart
In your IELTS test, it is recommended to complete your pie chart writing within 20 minutes. Your answer will be assessed based on your ability to:
» Objectively describe the main features presented in the chart.
» Make comparisons and note significant differences between categories.
» Present information clearly and accurately without including personal opinion.
Links to all Pie Chart pages:
Pie Charts – Part 1 | Part 2 (Current Page) | Part 3 |
Following is the list of IELTS pie charts (sample 21 to 40) with links to model answers that you should practise for your Academic IELTS test.
IELTS Pie Chart sample 21
[The diagrams give information on transport and car use in Edmonton]

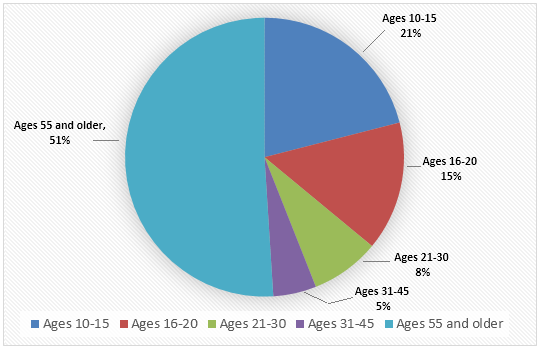
IELTS Pie Chart sample 22
[Visitors to a local cinema according to age in 2000]
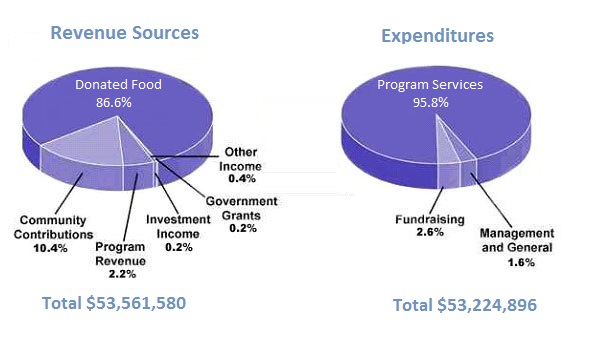
IELTS Pie Chart sample 23
[Money that a children’s charity in the USA spent and received]
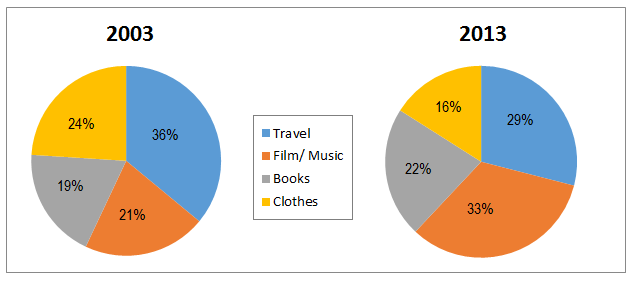
IELTS Pie Chart sample 24
[Online sales for retail sectors in New Zealand in 2003 and 2013.]
IELTS Pie Chart sample 25
[Monthly household income spent on various items by two groups]

IELTS Pie Chart sample 26
[Time younger and older people spend on various Internet activities]

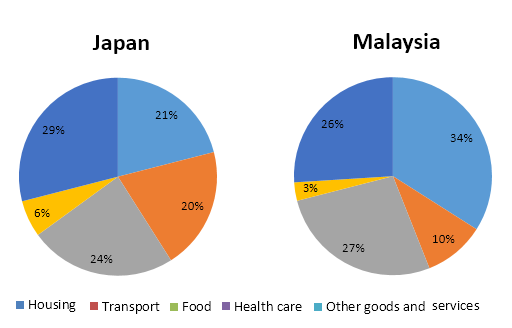
IELTS Pie Chart sample 27
[Household expenditures in Japan and Malaysia in 2010]
IELTS Pie Chart sample 28
[The main reason for learning a foreign language and a recent change in the reason.]

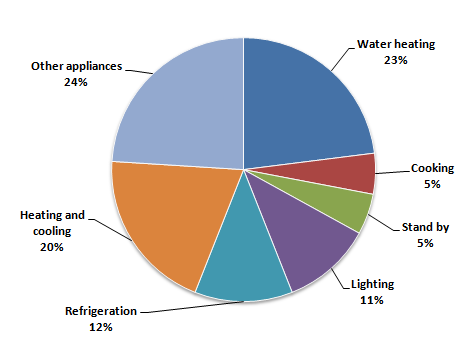
IELTS Pie Chart sample 29
[How energy is used in an average house in a European country.]
IELTS Pie Chart sample 30
[The pie charts show the types of music media used from 1990 to 2010.]
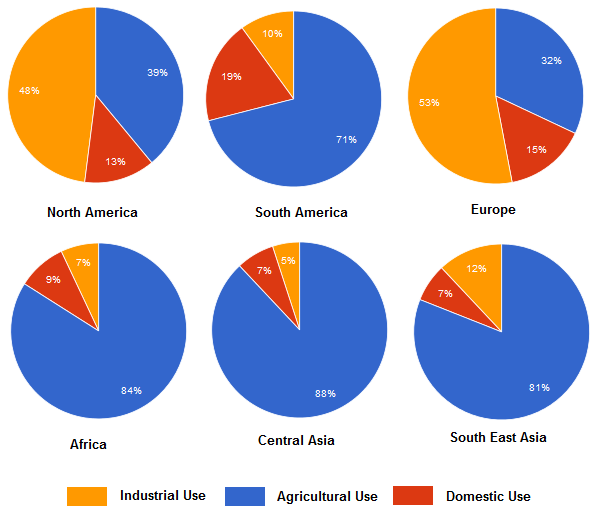
IELTS Pie Chart sample 31
[The percentage of water used for different purposes in six areas of the world.]
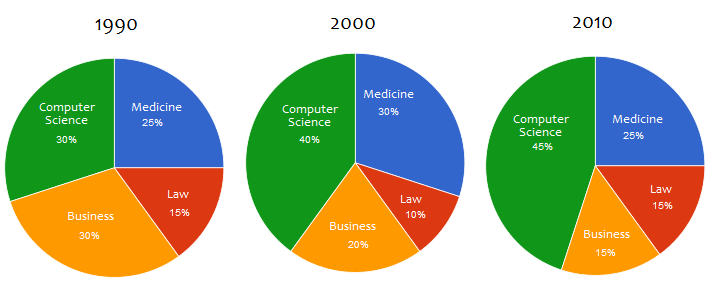
IELTS Pie Chart sample 32
[Degrees granted in different fields at the National University in 1990, 2000, and 2010.]
IELTS Pie Chart sample 33
[The results of a questionnaire that asked visitors to the Parkway Hotel and how they rated the hotel.]

IELTS Pie Chart sample 34
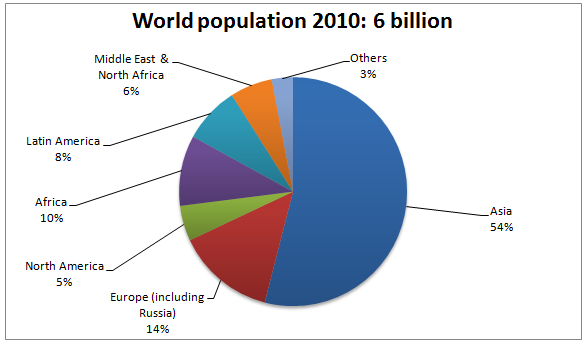
[Changes in world population by region between 1910 and 2010.]
IELTS Pie Chart sample 35
[Water usage in San Diego, California and the rest of the world.]

IELTS Pie Chart sample 36
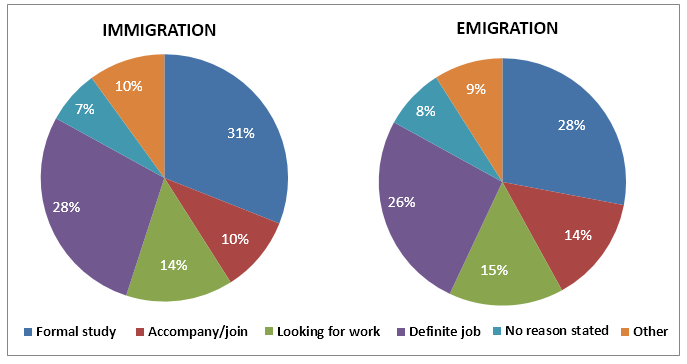
[The main reasons for migration to and from the UK in 2014.]
IELTS Pie Chart sample 37
[The main reasons for migration to and from the UK in 2014.]

IELTS Pie Chart sample 38
[What important aspects internship students have learned.]

IELTS Pie Chart sample 39
[Online sales for retail sectors in New Zealand in 2003 and 2013.]

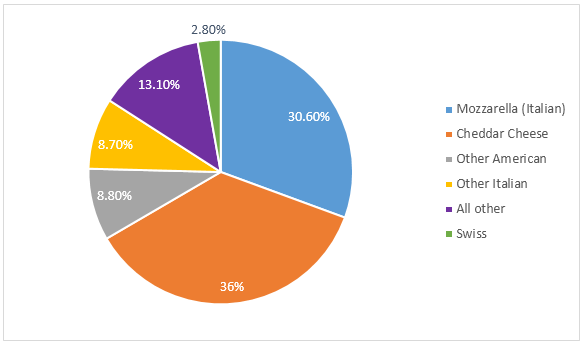
IELTS Pie Chart sample 40
[The relative percentage of different types of cheese production in the USA.]