IELTS Academic writing task 1 – Pie Chart
In your IELTS test, it is recommended to complete your pie chart writing within 20 minutes. Your answer will be assessed based on your ability to:
» Objectively describe the main features presented in the chart.
» Make comparisons and note significant differences between categories.
» Present information clearly and accurately without including personal opinion.
Links to all Pie Chart pages:
Pie Charts – Part 1 | Part 2 | Part 3 (Current Page) |
Following is the list of IELTS pie charts (sample 41 to 60) with links to model answers that you should practise for your Academic IELTS test.
IELTS Pie Chart sample 41
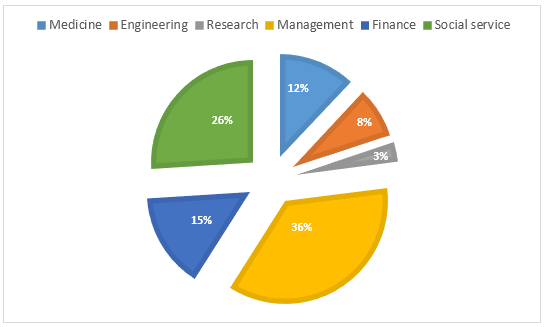
[New job opportunities for different professional groups in Australia.]
IELTS Pie Chart sample 42
[Proportion of holidaymakers staying in different accommodation.]

IELTS Pie Chart sample 43
[How much money is spent in the budget by the UAE.]

IELTS Pie Chart sample 44
[The pie charts show some employment patterns in Great Britain in 1992.]

IELTS Pie Chart sample 45
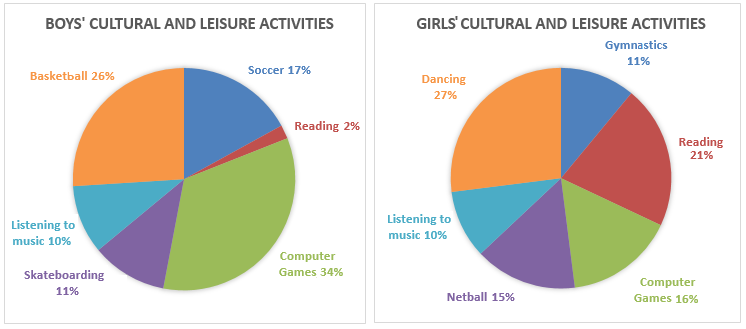
[The pie graphs show the result of a survey of children’s activities.]
IELTS Pie Chart sample 46
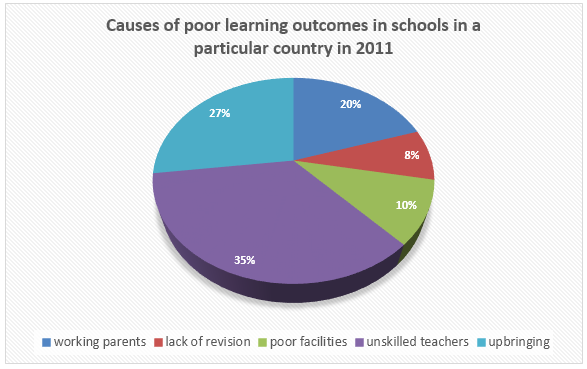
[Causes of poor learning outcomes in schools in 2011.]
IELTS Pie Chart sample 47
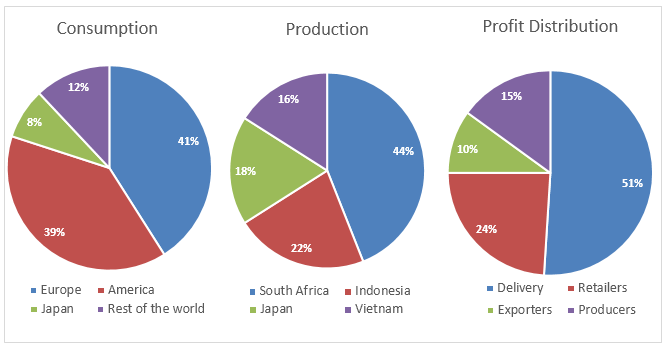
[Coffee production, coffee consumption and the profit distribution.]
IELTS Pie Chart sample 48
[How people in a European city reached their office and got back home.]

IELTS Pie Chart sample 49
[Average percentages in typical meals of three types of nutrients.]
