IELTS Academic writing task 1 – Table Chart
If you take the IELTS Academic test, you may be given one or multiple tables with data presented in rows and columns in your Writing Task 1 test. You will be asked to write a summary of the table data.
When writing an answer for a table chart in your Academic Writing Task 1, it is essential to follow a clear structure: an “introduction” that paraphrases the question, an “overview” that highlights the main trends or makes comparisons, and “two body paragraphs” that explain the details logically. Please avoid copying words from the question and never insert personal opinions.
Links to all Table Chart pages:
Table Charts – Part 1 | Part 2 (Current Page) | Part 3 |
Following is the list of IELTS Table charts (sample 21 to 40) with links to model answers that you should practise for your Academic IELTS test.
IELTS Table Chart sample 21
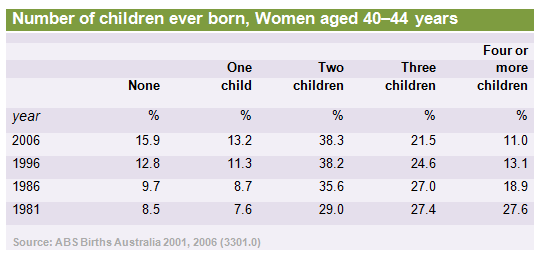
[The table below presents the number of children ever born to women aged 40-44 years in Australia for each year the information was collected since 1981.]
IELTS Table Chart sample 22
[The tables below give information about the amount of beer and fruit juice consumed per person per year in different countries.]

IELTS Table Chart sample 23
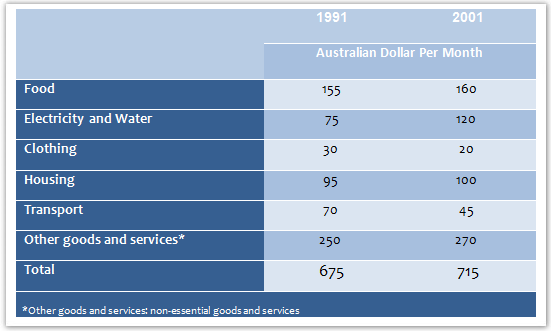
[The table below shows the monthly expenditure of an average Australian family in 1991 and 2001.]
IELTS Table Chart sample 24
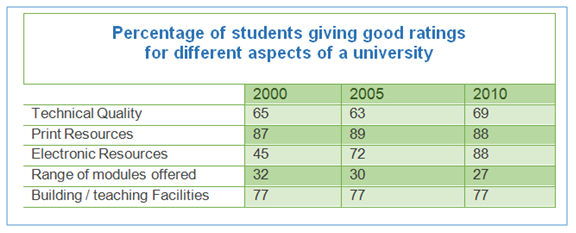
[The table below shows the results of surveys in 2000, 2005 and 2010 about one university.]

IELTS Table Chart sample 25
[The table illustrates the proportion of monthly household income spend on food and drink, housing, clothing and entertainment in five European countries.]

IELTS Table Chart sample 26
[The table below shows the number of kilometres passengers travelled on five types of transport in a European country in 1995, 2005 and 2015.]

IELTS Table Chart sample 27
[The table below shows the results of surveys in 2000, 2005 and 2010 about one university.]
IELTS Table Chart sample 28
[The table below shows sales made by a coffee shop in an office building on a typical weekday.]

IELTS Table Chart sample 29
[The table below describes percentages of homeschooled students in Some Country in 1999-2004.]

IELTS Table Chart sample 30
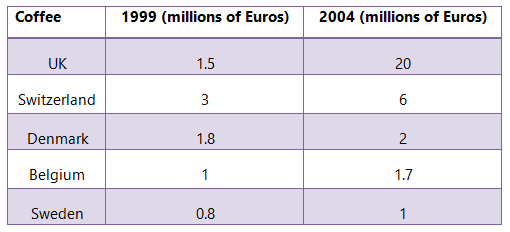
[The tables below give information about sales of Fairtrade*-labelled coffee and bananas in 1999 and 2004 in five European countries.]
IELTS Table Chart sample 31
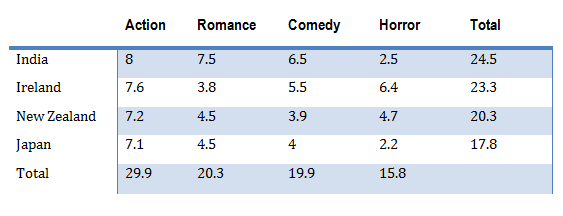
[The table below shows the cinema viewing figures for films by country, in millions.]
IELTS Table Chart sample 32
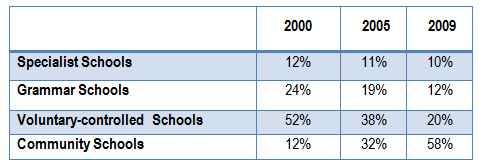
[The table shows the proportions of pupils attending four secondary school types between 2000 and 2009.]
IELTS Table Chart sample 33
[The table below shows personal saving as a percentage of personal income for selected countries in 1970, 1990 and 2010.]

IELTS Table Chart sample 34
[The chart below shows the results of a survey that sampled a cross section of travelers at a major metropolitan airport about the purpose of their trip. The survey was carried out during four different months in 2002.]

IELTS Table Chart sample 35
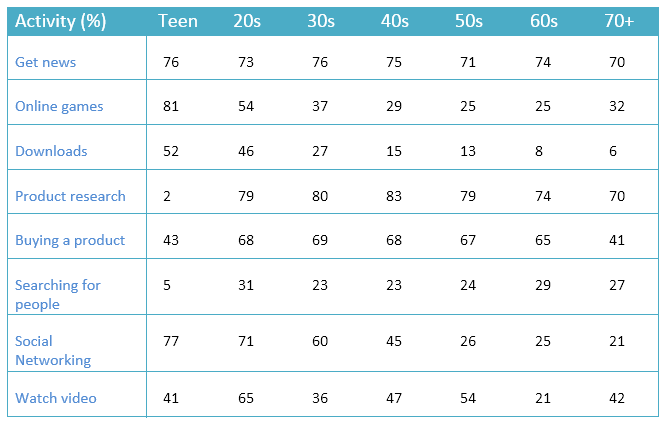
[The table below gives information about online activities of people in different age groups.]
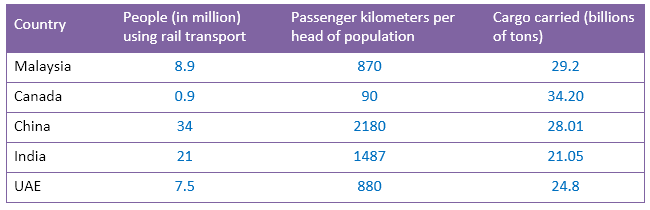
IELTS Table Chart sample 36
[The table below gives information about the rail transport in five countries in 2015.]
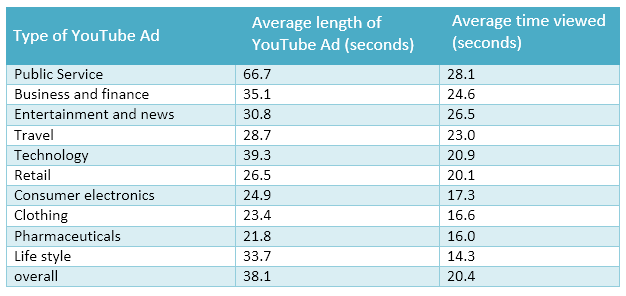
IELTS Table Chart sample 37
[The table below shows types of YouTube ads, their average lengths and how long people watch them.]
IELTS Table Chart sample 38
[The table below shows the sales at a small restaurant in a downtown business district.]

IELTS Table Chart sample 39
[The table below shows information about three different types of restaurants.]

IELTS Table Chart sample 40
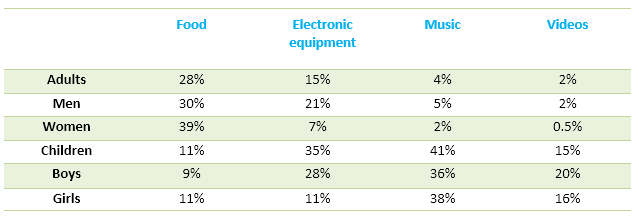
[The table data shows the proportion of income adults and children spent on 4 common items in the United Kingdom in 2005.]