IELTS Academic writing task 1 – Table Chart
In your IELTS Academic Writing Test 1, you will be given one or multiple graphs or charts to write a summary. Sometimes, it could be a table chart with data presented in rows and columns. Your task will be to write a summary of the table data.
When writing a summary to one or multiple table charts in your Academic Writing Task 1 test, you should follow a clear structure: an “introduction” that paraphrases the question, an “overview” that highlights the main trends or makes comparisons or contrasts, and “two body paragraphs” that explain the details about the main features of the data. Please note that you should avoid copying words from the question. Also, write about what is given in the data and illustration, and never give any personal opinions.
Links to all Table Chart pages:
Table Charts – Part 1 | Part 2 | Part 3 (Current Page) |
Following is the list of IELTS Table charts (sample 41 to 60) with links to model answers that you should practise for your Academic IELTS test.
IELTS Table Chart sample 41
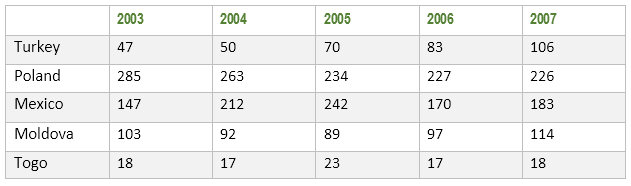
[The table gives information about the number of people working as researchers in technology per million people in five countries.]
IELTS Table Chart sample 42
[The table below shows the worldwide market share of the notebook computer market for manufacturers in the years 2006, 2007 and 2014.]

IELTS Table Chart sample 43
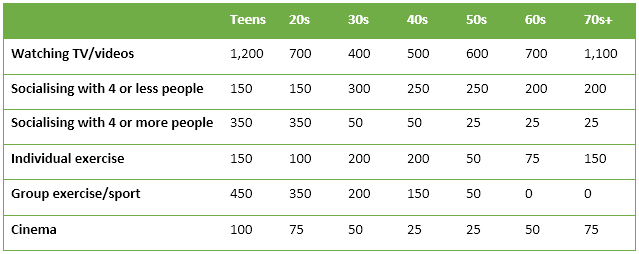
[The table below shows the leisure hours by Canadians in a year based on their age groups.]
IELTS Table Chart sample 44
[The table shows the amount of total waste produced in million tonnes in six different countries in three years.]

IELTS Table Chart sample 45
[The illustration below shows the proportions of people living in different types of houses in three different areas in 2012 in Denmark.]

IELTS Table Chart sample 46
[The table below shows the number of medals won by the top ten countries in the 2016 Rio Olympic Games.]

IELTS Table Chart sample 47
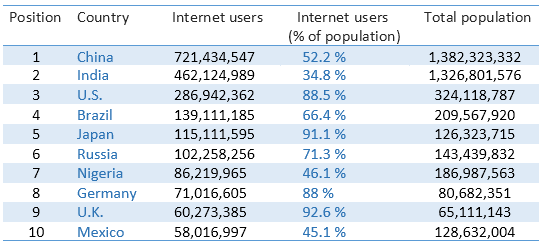
[The table data below shows the top ten Internet users by country in 2016.]
IELTS Table Chart sample 48
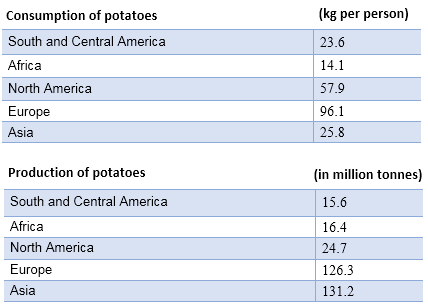
[The tables below provide information about the consumption and production of potatoes in five parts of the world in 2006.]