IELTS Academic Writing Task 1/ Graph Writing – Line Chart:
You should spend about 20 minutes on this task.
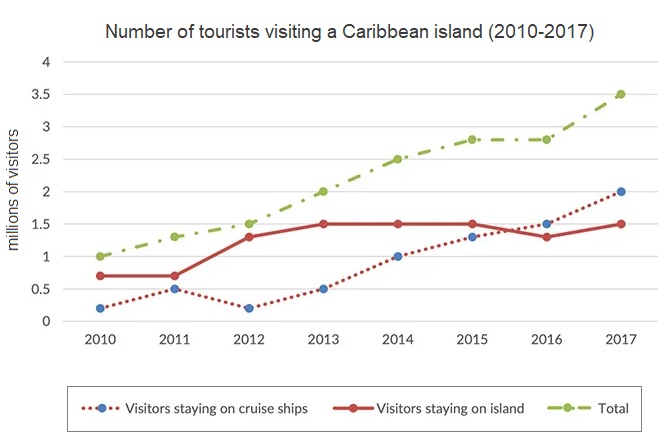
The graph below shows the number of tourists visiting a particular Caribbean island between 2010 and 2017.
Summarise the information by selecting and reporting the main features, and make comparisons where relevant.
Write at least 150 words.
Model Answer:
The line graph describes how many tourists visited a Caribbean island from 2010 to 2017, distinguishing between those who stayed on the island itself and those who stayed on cruise ships.
Overall, the total number of visitors to this Caribbean island increased sharply over the period, increasing from around 1 million in 2010 to approximately 3.5 million by 2017. Moreover, the number of tourists who stayed on cruise ships expanded at a notably faster rate than those who stayed on the island.
In 2010, one million travellers visited this Caribbean island, and roughly 0.75 million of them stayed on the island, while the rest stayed on cruise ships. Island-based tourism then grew gradually, reaching about 1.5 million by 2013. After a brief plateau in 2014 and 2015, the figure climbed again to around 1.5-2 million by 2017.
On the contrary, the number of cruise-ship visitors dramatically increased. After remaining relatively low until 2012, the number climbed steadily, overtaking island-staying tourists by mid-2015. By the final year, about 2 million people stayed on cruise ships, making it the larger of the two groups. As a result of growth in both categories, total visitor numbers rose continuously, with the most rapid expansion occurring between 2015 and 2017. By the end of the period, the island attracted more than three times as many tourists as it had in 2010, indicating a substantial improvement in the area’s overall tourism appeal.