IELTS Academic Writing Task 1/ Graph Writing – Table + Pie Charts:
You should spend about 20 minutes on this task.
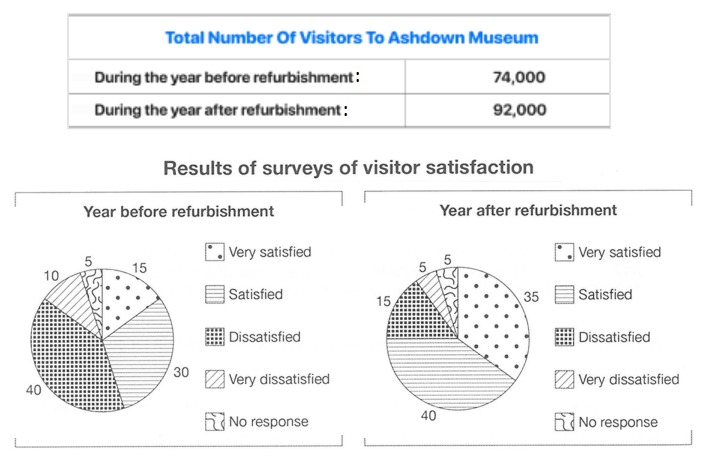
The table below shows the numbers of visitors to the Ashdown Museum during the year before and the year after it was refurbished. The charts show the results of a survey asking visitors how satisfied they were with their visit, during the same two periods.
Summarise the information by selecting and reporting the main features, and make comparisons where relevant.
Write at least 150 words.
Model Answer:
The table presents the number of visitors to Ashdown Museum in the year before and the year after its renovation, while the pie charts illustrate a survey result denoting how satisfied the visitors were in each of those years.
Overall, after the refurbishment, the museum not only received significantly more visitors but also saw a substantial improvement in visitor satisfaction.
In detail, before the Ashdown Museum’s renovation, exactly seventy-four thousand people visited the museum. In the year after the refurbishment, that number increased sharply by 18,000 and reached ninety-two thousand.
Looking at visitor satisfaction data, there was a dramatic positive shift after refurbishment. In the year before, 40% of visitors were dissatisfied, and 10% were very dissatisfied, which together made up half of all responses. Only 15% said they were very satisfied, and 30% were satisfied. In contrast, after the refurbishment, the proportion of very satisfied visitors more than doubled, rising to 35%, while the ratio of satisfied visitors also grew to 40%. Meanwhile, the ratio of dissatisfied visitors fell sharply to 15%, and those who were very dissatisfied dropped to just 5%. The percentage of non-respondents remained constant at 5%.