Links to all Line Graph pages:
Line Graphs with model answer: Part 1 | Part 2 | Part 3 | Part 4 (Current Page) |
Following is the list of IELTS Line graphs (part 4) with the links to sample answers. You should practise these questions as part of your preparation for the Academic IELTS test.
IELTS Line Graph Sample 61 with sample answer
[Line Graph: The line graph below shows the population size, birth and death rate of England and Wales from 1700 to 2000.]

IELTS Line Graph Sample 62 with sample answer
[Line Graph: The graph below shows waste recycling rates in the U.S. from 1960 to 2011.]

IELTS Line Graph Sample 63 with sample answer
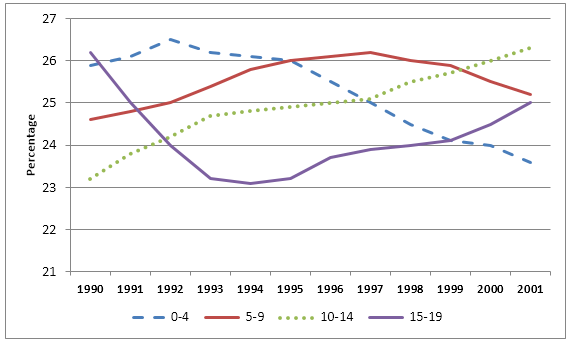
[Line Graph: The graph shows children by age group as a percentage of the young population in the United Kingdom between 1990 and 2001.]
IELTS Line Graph Sample 64 with sample answer
[Line Graph: The first graph gives the number of passengers travelling by train in Sydney. The second graph provides information on the percentage of trains running on time.]

IELTS Line Graph Sample 65 with sample answer
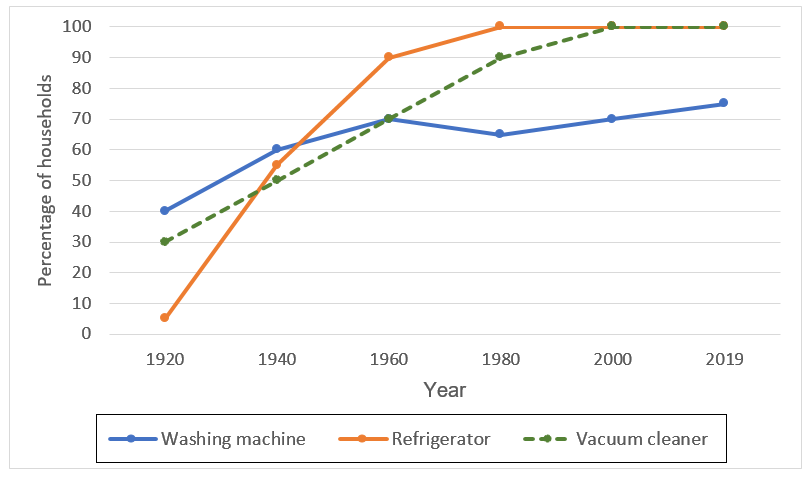
[Line Graph: The charts below show the changes in ownership of electrical appliances and the amount of time spent doing housework in households in one country between 1920 and 2019.]