Graph Writing # 113 - Student expenditure over a three-year period in the United Kingdom
- Details
- Last Updated: Tuesday, 28 July 2020 12:33
- Written by IELTS Mentor
- Hits: 52098
IELTS Academic Writing Task 1/ Graph Writing - Bar Graph:
» You should spend about 20 minutes on this task.
The chart shows student expenditure over a three-year period in the United Kingdom.
Summarise the information by selecting and reporting the main features, and make comparisons where relevant.
» Write at least 150 words.
Student expenditure (aged under 26 in higher education), United Kingdom *
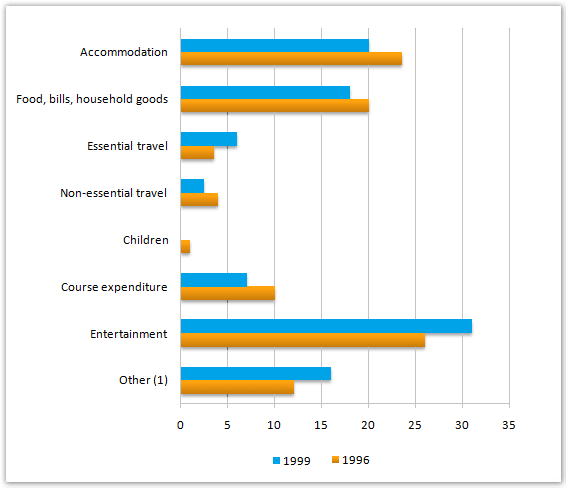
  (1) includes non-essential consumer items and credit repayments
      *Source: Student Income and Expenditure Survey. Department for Education and Employment.
Sample Answer:
The bar graph compares the expenses of students who were less than 26 years old and were in higher studies in the UK. It was presented based on the ‘Student Income and Expenditure Survey’ conducted by the Department for Education and Employment. The data is for the years 1996 and 1999 and the expenditures were classified into 7 main categories.
Overall, expenses by those students on food, course fees, bills, accommodations and non-essential travels decreased whereas the amount spent on entertainment, credit repayment, and essential travels increased.
As the data suggests, entertainment drained the highest amount of money both in 1996 and 1999 and the expenses on food, accommodation, household goods, non-essential travels and course decreased in 1999. Students in the UK spent 26% for entertainment in 1996 and after three years, it increased to 31%. They spent 23% for their accommodation in 1996 and it dipped to 20% in 1999. A similar pattern can be observed for the food, household goods, bills, course cost and non-essential travel for which students spent fewer percentages of their money. About 1% of total expenses were for children in 1996, possibly by students who were also parents. Moreover, in 1996, the expense for courses was 10% and that decreased to 7% after three years. Non-essential consumer items and credit repayments were categories in ‘Other’ and that comprised 12% cost in 1996 whereas it increased by 4% in 1999.

Report