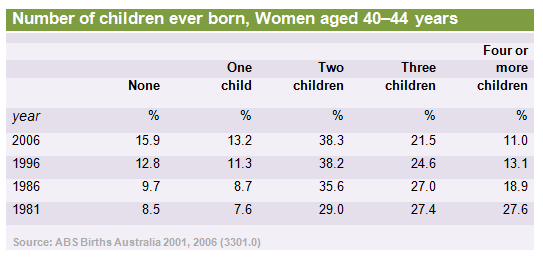
Graph Writing # 115 - Number of children ever born to women aged 40-44 years in Australia
- Details
- Last Updated: Tuesday, 28 July 2020 12:33
- Written by IELTS Mentor
- Hits: 92563
IELTS Academic Writing Task 1/ Graph Writing - Table:
» You should spend about 20 minutes on this task.
The table below presents the number of children ever born to women aged 40-44 years in Australia for each year the information was collected since 1981.
Summarise the information by selecting and reporting the main features, and make comparisons where relevant.
» Write at least 150 words.

Sample Answer 1:
The given data shows the number of children born to 40-44 years old women in Australia for 4 different years. The number of women from 40- 44 years old who had either one child or none, increased over time while this number decreased for the women of the same age group who had two or more children.
In 1981, the percentage of women in 40-44 years age group who has no children was 8.5% and in 1986 this percentage increased slightly and reached to 9.7%. The women of the same age group with one child were 7.6% in 1981 and reached to 8.7% 5 years later. The percentages of women who fall in the same age category with 2-4 and more children were much higher (approximately 28%).
In 1996 and 2006 (with a 10 years interval) the percentage reached to over 15% for childless women while it reached to 13% for women with 1 child. The percentage of women with 2 children had very little change while the percentage for three of four children decreased over time.
In summary, the women from 40-44 years old had more children initially and this percentage decreased over time.
Sample Answer 2:
The table graph explicates the gathered statistics of children born to women aged from 40-44 years in Australia. The data is given since 1981 and it illustrates the figures of 1981, 1986, 1996 and 2006.
Overall, the proportion of women who had given birth to three or more children had considerably plunged and mothers who had no children were surged by each year.
In 1981, the utmost four or more infants were born by women with the figures of 27.6% but it was plunged from the year 1981 to 1996 and finally, it fell to 11.0% in 2006. Similarly, the maximum proportion of women who had given birth to three children was 27.4 percent and 27 percent in the year of 1981 and 1986 respectively. The remaining two years were minimal in the birth of three children by the women aged 40-44.
Moreover, two children were given birth by more women in the year of 2006 and 1996. It was nearly correlative to each other with the figures of 38.3% and 38.2% while 29% of two children were given birth by women in the year of 1981. However, childless women’s number upsurged in 1996 and 2006 from 12.8 percent to 15.9% but women with no child plummeted from 9.7 percent to 8.5 percent in the year 1981. In the case of one child, the proportion decreased in the first two years of the given graph then dropped to 7.6 percent in the last year.
[ Written by - Preet Singh ]

Report