Graph Writing # 23 - Amount of money spent on fast foods in Britain
- Details
- Last Updated: Sunday, 08 May 2022 14:59
- Written by IELTS Mentor
- Hits: 433367
IELTS Academic Writing Task 1/ Graph Writing: Column Graph + Line Graph:
» You should spend about 20 minutes on this task.
The chart below shows the amount of money per week spent on fast foods in Britain. The graph shows the trends in consumption of fast foods.
Write a report for a university lecturer describing the information shown below.
» You should write at least 150 words.
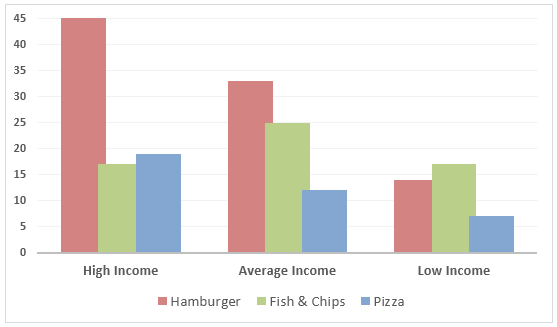
Expenditure (Pence per person per week) on fast foods, by income groups, UK 1990
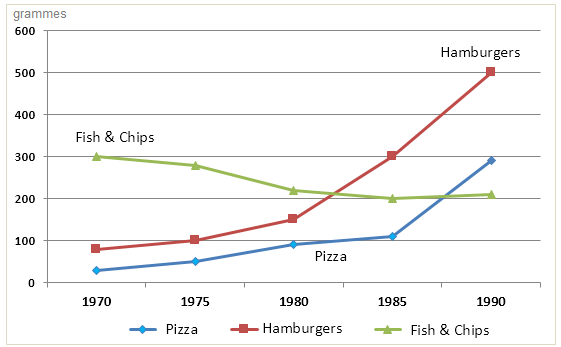
Consumption of fast food per person in gram (1970-1990)
Model Answer 1:
The graph shows the average expense of rich, middle-class and low income British on three fast food items, namely - hamburgers, fish & chips and pizza, in 1990 as well as the consumption of these three fast foods between 1970 and 1990.
Overall, affluent British consumed considerably more fast foods than middle and low-income class people, and their spending was higher as well.
As the column graph suggests, rich British ate noticeably more fast foods than the other two income groups in 1990. Their spending was more than twice as much on hamburgers (43 pence per person per week) than on fish and chips and pizza (both under 20 pence per person per week). The average income group alose preferred hamburgers, spending 33 pence, followed by fish and chips (24 pence) and pizza (11 pence). Finally, low-income earners appeared to spend less than other income groups on fast foods. Fish and chips were their favourite fast food item followed by hamburgers and pizza. They spent less than 20 pence per person each week on fish and chips and less than half of that on pizza.
The line graph delineates that fish and chips were twice as popular (300 grammes consumption per person) as hamburgers while the pizza was the least popular (less than 50 grammes consumption). The consumption of hamburgers and pizza increased steadily from 1970 to 1990 while the intake of fish and chips declined over that same period.
Sample Answer 2:
The bar chart compares the weekly expenditures of the British on three fast food items in 1990 while the line graph shows the consumption of these items from 1970 to 1990.
Overall, expenditures on fast foods varied depending on people’s income class. Moreover, 'fish & chips' was the most consumed item in the 70’s, but in later decades, consumption of hamburgers increased remarkably - exceeding the consumption of the other two items.
According to the bar graph, high-income class people spent more money on hamburgers (more than 40 Pence/person) than on fish & chips and pizza. Their spending was also higher than average and low-income class people on pizza. Besides, the average income group spent more on hamburgers but their spending on fish and chips (25 pence) was more than the other two income groups. Finally, the low-income class spent comparatively less on fast foods and fish & chips cost them the most (about 17 pence). They spent the least amount on purchasing pizza (around 7 pence/person).
Moreover, the line graph shows the consumption of these items by the British from 1970 to 1990. Initially, fish & chips consumption in Britain was highest (300 gm/ person) in 1970. This year, less than 80 gm of hamburgers and pizza were consumed by an average person. Over time, fish & chips consumption declined and hamburgers became the most consumed item in 1990 with 500 gm consumption per person.
Model Answer 3:
The column graph shows how much money the British citizens spent on three fast food items in 1990 while the line graph reveals the consumption of these items between 1970 and 1990.
Overall, rich British spent more on junk food than the low-income class in 1990 and hamburgers became the most consumed junk food over the period.
In details, wealthy British spent more on hamburgers while less on fish & chips. They drained around 45 pence per person in a week for hamburgers while roughly 15-20 pence on the other two items. The moderate-income class prefered hamburgers but spend approximately 33 pence on that. They spent the least to purchase pizza which amounted to nearly 12 pence. Low-income class, on the contrary, spent less on fast foods and they spent between 7 to 14 pence for each item, despite fish and chips being their favourite.
According to the line graph, British citizens consumed fish & chips more than the other two items in 1970. Their consumption of fish & chips accounted for 300 gm per person while it was less than 100 gm for the other two items. Over time, hamburgers became the most consumed fast food with 500 gm consumption in 1990.
Sample Answer 4:
The graphs present data on the amount of money spent by the British on fast food in 1990 and the consumption of three junk food items over 30 years. The expenditure is given for each person in a week in Pence while the consumption is presented in grammes per person.
Generally speaking, hamburgers gained popularity over time while fish & chips started to be consumed by less percentage of British.
As is presented in the bar graph, in 1990, British people in the high-income range spent more than 40 Pence in a week on hamburgers which was higher than that of other items. They spent only 16 pence/person on fish & chips while around 2 pence more on pizza. Again, the hamburger was the most popular item among the medium income class. They spent over 30 pence on this item while 5 Pence less on fish & chips, and just 11 Pence/person on pizza. Finally, among the low-income group, fish & chips was the most popular fast food item as they spend the highest money on this (17 Pence per week by an individual). Their expenditure on the pizza was only 6 Pence.
According to the line graph, people ate fish & chips more than any other fast food in 1970. UK citizens, this year, devoured more than 300 grams of fish & chips while they consumed less than 100 grams of hamburgers and fish & chips. The average pizza consumption started growing and reached 300 grammes in 1990.

Overall, we can see that the consumption of fast food increased with economic solvency. And with time, fish and chips lost its appeal whereas the popularity of hamburgers and pizza increased.
We can see that people with higher income in 1990 in the UK ate hamburgers the most, which was 37 to over 42 pence per week. On the other hand, low-income people consumed fish and chips the most, near about 20 pence weekly. The graph also shows that the consumption of pizza among British people was less than half of hamburgers.
If we look at the overall consumption period of 20 years starting from 1970, it is shown that the consumption rate of fish and chips was much higher but declined slowly for the next 16 years. Whereas, the popularity of the other two fast food items climbed gradually for the first ten years then jumped higher for the rest of the time. Still, hamburgers hold a higher position in terms of consumption.
According to the bar chart, people of high and average income groups spent the most on hamburgers. A person from the high-income group spent over 40 pence per week on hamburgers, while around 20 pence for fish and chips, and pizza. On the other hand, "fish and chips" is the most popular fast food item among the low-income group population. A person belonging to the low-income group spend around 23 pence, 14 pence and 8 pence on fish and chips, hamburgers and pizza respectively.
It is conspicuous from the line graph that 'fish and chips' has gradually lost its popularity while the consumption of hamburgers had risen in an exponential manner from over 20 years. The consumption of hamburgers had increased from 100 gramme to over 500 gramme. Around the year 1990, pizza consumption crossed the fish and chips consumption.
Overall, we can observe that British citizens spent a higher amount of money on the hamburger(s) and fish and chip(s) whereas the demand for pizza had declined steadily over 20 years’ time period despite being the most popular among the three fast-food items from 1970 to 1980.
Now, turning over to the details, a person from any income category liked to consume hamburger(s) in 1990. A person from the higher-income group spent 45 pence per person per week this year, which was the highest for any fast food item. They spent less than half of that amount on other fast foods. A similar trend could be observed by the average income group persons when it comes to their fast food preference in that year, but they spent more on fish and chips than the rich people. However, the lower-income group preferred to spend more on fish and chip(s) which is approximately 12 pence by a person and spent the lowest on pizza which was 5 pence per person.
From the next line graph, it is conspicuous that consumption of fish and chip(s) and hamburgers made progressive growth from 1970 to 1980 (which was ranging from 50 grams to 150 grams) but increased dramatically from 1980 to 1990 (up to 500 and 300 grams respectively). On the contrary, we can see that pizza eaters have declined slightly from 1970 to 1980 but then stabilized from 1980 to 1990. Pizza consumption descended from 300 grams (which was the highest consumed fast food in 1970) to 200 grams in 1990.
Overall, it is clear that hamburger was the most popular choice of fast food by rich and middle-class consumers in 1990 while low-income people preferred fish and chips. Moreover, the popularity of fish & chips soared rapidly during 1980 and 1990.
According to the bar chart, people in the high-income group spent more money on hamburgers, with about 45 pence per person than on fish and chips and pizza. Average income people also spent the highest on hamburgers but their expenditure on fish and chips was much higher than other income groups (about 25pence per person). Finally, in the low-income group, "fish and chips" was the most consumed fast food item that cost them the most (about 17 pence per person). Pizza was most popular among rich people while least among the other two income groups.
Now looking at the information in more detail, we can see that in 1979, pizza was the most popular of these fast food items, with about 300 grammes consumption per person. The other two items (hamburger and fish and chips) were consumed in similar quantities (below 100 grams). However, during the next twenty years, the consumption of pizza fell dramatically to approximately 100 grams. In 1970, the consumption of fish and chips was just 50 grams per person, but it reached 500 grams - a staggering 10 times more, four decades later.
Report