Graph Writing # 44 - Food budget average family spent on restaurant meals
- Details
- Last Updated: Monday, 20 July 2020 16:09
- Written by IELTS Mentor
- Hits: 201085
IELTS Academic Writing Task 1/ Graph Writing - Pie Chart + Line Graph:
» You should spend about 20 minutes on this task.
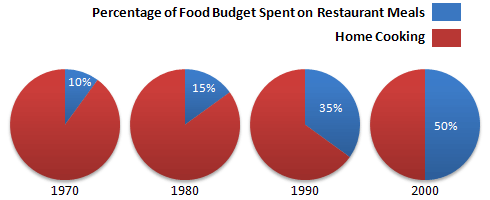
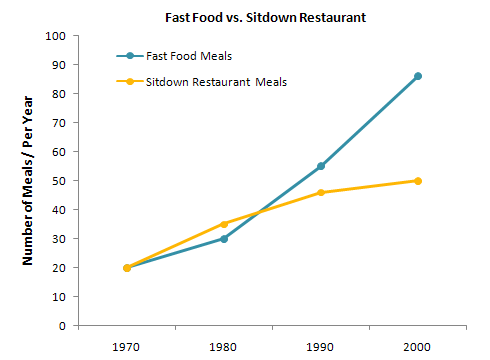
The charts below show the percentage of food budget the average family spent on restaurant meals in different years. The graph shows the number of meals eaten in fast food restaurants and sit-down restaurants.
Write a report for a university lecturer describing the information in the graph below.
» You should write at least 150 words.
Model Answer 1:
The illustration demonstrates how people’s tendency to have outside meals augmented between 1970 and 2000 and the ratio of food budget they spent on homemade food and restaurant meals. Generally speaking, people ate a higher number of outside meals over the time and their spending on that increased noticeably.
As can be seen, people spend one-tenth of their food budget to dine outside in 1970 and had around 40 meals outside the home of which 20 meals were taken from fast food shops. Next decade, their expenditure ratio on homemade food declined and they spend 5% more for enjoying meals from a restaurant. In 1980, they ate approximately 60 meals at a bistro of which roughly 35 were fast food meals. Over the time, their spending ratio on restaurant meals soared and in 2000, they had around 90 fast food meals and 50 sitdown restaurant meals. It is worth noticing that this tendency swelled their food budget for cafeteria meals as they spend half of their food funds to enjoy outside meals.
Sample Answer 2:
Given are two kinds of figure concerning how much the average family spent on food in four years from 1970 to 2000. The first chart provides information about the spent on restaurant meals (in percentage), while the second one illustrates how many fast food meals and sit-down restaurant meals were in each year.
The most significant point in the pie charts is that between 1970 and 2000 there was a considerable growth from one-fifth in the first year of the period to exactly a half in 2000. That is a rise of forty percent in a thirty-year period.
The most striking feature to comment on in the line chart is that even though both numbers of fast food meals and sit-down meals started at the same point, a mere twenty meals, however, had two different endings. In 1980, the number of sit-down suppers rose respectively to approximately thirty-five, while the number of quickly served meals experienced a smaller increase. However, in twenty years after that, the proportion quickly reached a peak at relatively ninety, considerably forty meals more than that of sit-down restaurant meals.
It is interesting to note that through more than thirty years, having meals in a restaurant whether in fast food or sit-down one has become very popular.
(Approximately 211 words | Written by - Quynh Tran )
Sample Answer 3:
The given illustration compares the amounts spent on restaurant foods and on home cooking foods in four different years and gives data on the number of meals eaten in two different restaurant types.
As is presented in the pie chart, initially in 1970, 90% of total food budget was spent on home-made foods while only 10% was spent on restaurant foods. The amount spent on restaurant meals increased to 15% in 1980 while it reached to 35% in 1990. Finally, in 200, an average family spent half of the total budget in restaurant meals and that shows a rapid increase in the people’s habit of having meals in restaurants.
In the line graph, we can observe that in 1970, the fast foods and sit-down restaurant meals were taken 20 thousand times each and over time these numbers kept increasing. Finally, in 2000, more than 90 thousand fast food meals were eaten while the sit-down restaurant meals were eaten 50 thousand times a year. This indicates the changes in people’s habit of eating out and the popularity of restaurant foods over the home-made foods.
In summary, over the 30 years’ time, people adopted the habit of eating out at restaurant and sit-down restaurant gained more popularity over the fast food shops.
(Approximately 209 words)
( This model answer can be followed as an example of a very good answer. However, please note that this is just one example out of many possible approaches.)
Sample Answer 4:
The bar graph illustrates the proportion of the money spent by an average family on having meals in a restaurant on four selected years whereas the line graph depicts how many meals they have eaten in two types of restaurant.
Overall, it is clear that there was an increasing trend in the money spent on having meals in restaurants throughout the years and fast food restaurant was favoured by people than in a restaurant.
First of all, the proportion of money spent on eating in restaurant increased from 1970 to 2000. In 1970, there was only 10% of their food budget spent on eating in restaurants whereas, in 2000, it rose to 50%. Turning to the preference of people of choosing restaurants, there was an equal number of people having meals in fast food restaurants and sit-down restaurants (about 20 meals per year) in 1970. An overall rising pattern can be seen for both the restaurants, however, the fast food restaurant went up slowly from the year 1970 to 1980 before it continued to rise steadily and reached its peak in 2000 at just under 90 meals per year, which was almost doubled that of sitdown restaurant in the same year. Interestingly, sitdown restaurants showed a rapid increase in the number of meals per year which reached a higher point than fast food restaurant from 1970 to 1980 but it slowed down after 1980.
( Written by - Alfred Lee )
Sample Answer 5:
The pie chart illustrates the percentage of food budget spent by an average family on restaurants meals and at home in 1970, 1980, 1990, and 2000, while the graph compares the meals eaten in fast food shops and sit-down restaurants in those years.
It can be clearly seen that the proportion of food budget spent on restaurant meals had increased over the period. In 1970, just 10% of total food budget was spent on restaurant meals. This amount had risen by 5% in 1980. The percentage continued to increase to 35% in 1990 and in the year 2000, the proportion of food budget spent on restaurants and home cooking had been equal (50:50).
From the graph, it is evident that the number of meals eaten both in fast food and sit-down restaurants had increased during the period. In 1970, the number of eaten meals in those two kinds of restaurants were the same (20 meals/year). In 1980, the number of meals eaten in sit-down restaurants was higher than the meal eaten in fast food restaurants. However, in the following period, the number of fast food meals boomed to approximately 55 meals/year and 90 meals/year in 1990 and 2000 respectively while the number of food eaten in sit-down restaurants just increased moderately, from 35 meals/year in 1980 to 45 meals/year in 1990 and 50 meals/year in 2000. It is evident from the graph that fast food gained more popularity over the period and the number of meals eaten outside increased significantly.
( Written by - Titi )
Model Answer 6:
The pie charts outline the ratio of food budget people spent on preparing meals at home and on restaurant meals and the line graph delineates what type of outside food people preferred between 1970 and 2000. Overall, people’s spending on restaurant meals increased significantly over the period and fast food became more popular over the time.
As is presented in the illustration, people spent 10% of their food budget to have outside meals in 1970 and this spending ratio enlarged each decade. In 1990, they spent more than one-third of the meal budget to eat at restaurants and finally in 2000, people spent half of their food budget to eat outside.
The line graph shows that people ate 20 fast food meals in 1970 and the same number of sitdown eatery meals in this year. After a decade, the number of sitdown dining occurrence went slightly higher than the number of fast food meals they had. However, the popularity of fast food remarkably increased and people ate as high as 90 meals in fast food shops in 2000 when they had around 50 sitdown meals in this year.

Regarding the percentage of food budgets spent on restaurant meals, a steady increase is observed. It began at 10% in 1970 and reached a peak of 50% in 2000. This suggests a growing reliance on restaurants for meals over time.
When analyzing the number of meals eaten in fast food and sit-down restaurants, a clear trend emerges. Fast food consumption experienced a dramatic rise, going from a relatively low level in 1970 to a much higher number in 2000. In contrast, the number of meals eaten in sit-down restaurants remained relatively stable, showing only a moderate increase.
In summary, the data reveals a substantial increase in restaurant meal consumption, with fast food becoming increasingly popular. This shift likely reflects changes in lifestyle, such as busier schedules and the convenience of dining out, as well as the growing affordability and availability of fast food options.
Kindly check my writing task 1, and give me honest feedback.
In general, the percentage of expenses on home cooking has declined by nearly half over the course of several years, whilst the spending surged by five times on restaurant meals. Additionally, the sum of fast food meals eaten annually had a significant increase, whereas the increase was roughly half for the sitdown meal in contrast to fast food meals.
In detail, the spending of food allowance plan on home cooking from 1970 to 2000 seems to have a considerable drop in percentwise from 90% to 50% with a noticeable drop in 1990. At the same time, the outgoings on restaurant meals have increased by a factor of five - from 10% to 50%.
Furthermore, the figure for the total fast food meals eaten per year moved upward from 20 to 90 with a steady pace from 1980. On top of that, the total sitdown meals consumed grew from 20 to roughly 40 with a decline in the rate from 1980.
Overall, throughout the period there was a dramatic decline in-home cooking and an enormous climax in meals eaten in fast food restaurants.
In 1970, 90% of households preferred to eat at home instead of spending outdoors, and a decade later this percentage dropped to 85%. However, 35% of householders chose to eat at a restaurant meal in 1990, and money spent from income on outdoor meals rapidly increased and became half of the total.
In 1970, the number of meals eaten at fast-food and sit-down restaurants was 20 meals a year and a decade later, fast food intake increased by 10 meals, while that of side-down restaurants increased by 15 meals. However, after 1980, the fast-food intake trend showed a contingent trend in their sales which was 90 meals in 2000 whereas in the sit-down restaurant it only increases by 15 meals throughout the period of 20 years.
Overall, eating out became more common over the years, while its share in budget increasing noticeably.
Home cooking was very much the main expenditure in the average family’s food budget in 1970. Only 10% of the money was spent on restaurants and this increased slightly in the following decade. Yet, meals eaten in restaurants stood for less than 70 meals in total per year. Also, sit-down meals were more preferred than fast food until the mid-1980s.
However, after 1980, the number of meals eaten in restaurants increased considerably, as did their share in the budget. Fast food meals gained popularity over sit-down meals and widen the gap during the rest of the period. In 2000, restaurant meals were responsible for half of the budget. The number of meals eaten in fast food restaurants rocketed to almost 90 meals per year, however, this figure stood at 50 for sit-down restaurants.
Overall, the proportion of spending on restaurants increased consistently throughout 30 years; additionally, at the same time, fast food became more popular than restaurant meals.
In 1970, only one-tenth of total spending on meals was for restaurants. However, after 2 decades, this figure increased more than three-fold. And by the end of the given 30-years period, spending on out-dining was precisely equalled to that on home cooking.
Regarding the line graph, the number of meals that an average family had, both in fast food and sitdown restaurants, saw an upward trend as time went by. The figures stood at 20 fast-food meals per year in 1970, equaling the statistic of restaurant dining. The latter surpassed 30 after 10 years and by the year 2000, an average family had around 45 meals in restaurants. As for fast food chains, the figure skyrocketed between the years 1980 and 2000, standing at 55 meals in 1990 and 85 meals by the end of the given period.
Overall, it can be seen from the pie charts that there was a growing trend in expenditure on restaurant meals over the period given, whereas families became more interested in having fast food compared to eating in sit-down restaurants.
As is shown in the pie charts, families spent one-tenth of their food budget on restaurant meals in 1970, which saw a 5% increase next decade. However, in 1990, this figure more than doubled and stood at 35%. In the following decade, half of the total food budget of households went into restaurant meals.
Regarding the data from the line graph, interestingly, families used to have an equal number of meals (20/per year) in fast-food and sit-down restaurants in 1970. In the following decade, the number of meals for sit-down restaurants steadily rose to around 35 annually, while fast food saw a noticeable climb to about 30/per year. However, after 1980, there was a dramatic increase in the number of meals eaten in a fast-food restaurant, overtaking that of sit-down restaurants in around 1985 and reaching a peak of 90 meals per year at the end of the period. On the other hand, nearly 50 meals were eaten on average in a casual-dining restaurant in 2000.
Report