Graph Writing # 197 - British Emigration to selected destinations
- Details
- Last Updated: Wednesday, 26 August 2020 00:03
- Written by IELTS Mentor
- Hits: 29932
IELTS Academic Writing Task 1/ Graph Writing - Bar Graph:
» You should spend about 20 minutes on this task.
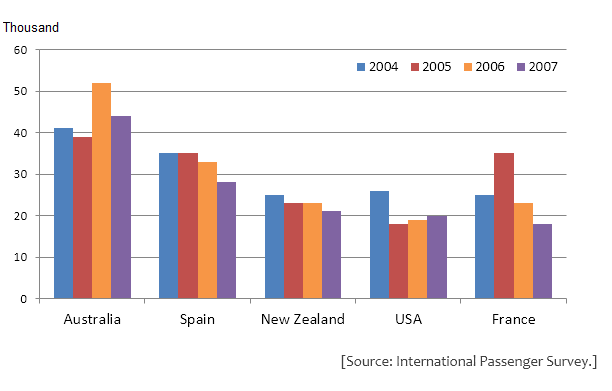
The chart shows British Emigration to selected destinations between 2004 and 2007.
Summarise the information by selecting and reporting the main features, and make comparisons where relevant.
» You should write at least 150 words.
BRITSH EMIGRATION TO SELECTED DESTINATIONS: 2004-2007

Sample Answer:
The column graph compares the number of emigrated British to five different countries within a span of four years’ time commencing from 2004. The data was taken from International Passenger Survey and it clearly outlines that Australia was their favourite country for settlement in the given period.
Getting back to details, just over 40 thousand British arrived in Australia in 2004 which was the highest number of British citizens immigrated to any country. In this year nearly 25 thousand British went to New Zealand, USA and France while 35 thousand went to Spain, making it the second favoured destination for UK residences. In the consecutive years, Australia remained their hot destination and more than 50 thousand British went to this country in 2006 alone. Interestingly, the number of British migrated to Spain slowly decreased in the final two years and this trend was also true in the case of British people’s migration to New Zealand and USA. Around 20 thousand British shifted to the USA and New Zealand in 2007 while this figure was slightly more in Spain. Total migrated British in Australia in 2007, on the other hand, was somewhat 43 thousand.

Report