IELTS graph writing # 208 - Area of forest logged in and forest-dwelling species in Southwest region
- Details
- Last Updated: Wednesday, 26 August 2020 00:08
- Written by IELTS Mentor
- Hits: 24294
IELTS Academic Writing Task 1/ Graph Writing - Bar Graph + Table:
» You should spend about 20 minutes on this task.
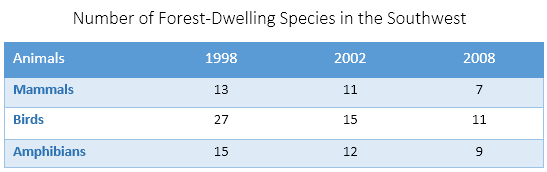
The bar graph below shows the area of forest logged in Southwest region and the table presents the number of forest-dwelling species in the same region.
Summarise the information by selecting and reporting the main features, and make comparisons where relevant.
» You should write at least 150 words.

Sample Answer:
The given bar graph shows the total area that was logged in the Southern region in four different years and the table shows the number of mammal, bird and amphibian species in this region. A glance at the illustration reveals that login activities in the Southern region increased over the time and the number of species as an effect have decreased.
Getting back to the details, 75 thousand acres of forest was cut down in 1990 and it just doubled in 10 years. Finally, in 2010, exactly 225 thousand acres forest was logged down and this was more than thrice the logging area in 1990. The table shows that in 1998 there was 13 mammals, 27 birds and 15 amphibian species in the Southeast forests and this number kept on decreasing over the time. In just four years, 2 mammal species disappeared from the forest and in 10 years 6 mammal species disappeared. The worst case was for birds as in 2008 the number of bird species declined to only 11 from the initial figure 27 in 1998. In the case of amphibians, more than 6 species got lost from the forest in just 10 years.

Overall, it can be seen that the logging increased throughout 20 years, and as a result, the number of forest species declined as time went by.
Initially, 75,000 acres of forest land was cut down in 1990, then it surged to exactly 100 thousand acres five years later. Furthermore, the figure in the year 2000 (150,000 acres) was exactly twice that of a decade ago, and by the end of the period, it rose by one-half to become 225 thousand acres. It is worth noticing that logged area increased 3-fold in total throughout 20 years.
Regarding the table data, bird species saw the most significant loss, as the number decreased from 27 in 1998 to just 11 species in 2008. The loss, in the first four years, was more significant than since 2003, as there were disappearances of 12 species by the year 2002.
An opposite trend was true for mammals as the majority of reduction can be seen in the last six years, from 11 in the year 2002 down to 7. Amphibians declined steadily from 15 to 9 species after 10 years.
Report