IELTS graph 238 - Online shopping sales for retail sectors in Australia
- Details
- Last Updated: Tuesday, 03 October 2017 13:00
- Written by IELTS Mentor
- Hits: 53414
IELTS Academic Writing Task 1/ Graph Writing - Pie Charts:
» You should spend about 20 minutes on this task.
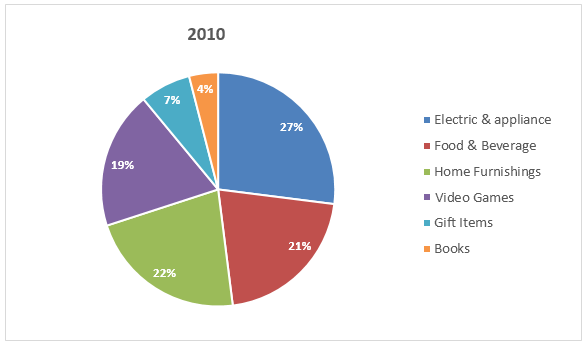
The pie charts below show the online shopping sales for retail sectors in Australia in 2010 and 2015.
Summarise the information by selecting and reporting the main features and make comparisons where relevant.
Write at least 150 words.

Sample Answer:
The pie charts compare the online retail shopping trends in Australia in 2010 with that of 2015. Overall, electronic product, food and furniture comprised the highest percentage of online sales in Australia in both years.
According to the illustration, 27% online retail sale in Australia in 2010 was made by electric appliances, which was followed by home furnishing and food & beverage commerce with exactly 22 and 21 percentage respectively. Video games purchased by Australian consumers comprised 19% of total online sales in this year. Finally, gift and book sales accounted 7% and 4% online retail sales consecutively in 2010.
After half a decade, electric products’ sales increased by 5% and it comprised one-third of the total online sales in 2015. E-commerce of food & beverage items slightly increased while a nominal decrease could be observed in the trade ratio of furniture. Video games became less popular among Australian online consumers as its sale dropped below half while a surge could be noticed on the gift items' sale ratio. Books as an online retail product were sold more in percentage in 2015 than that of 2010.

Report