Graph Writing # 56 - Number of houses built per year in two cities Derby and Nottingham
- Details
- Last Updated: Monday, 20 July 2020 16:16
- Written by IELTS Mentor
- Hits: 65263
IELTS Academic Writing Task 1/ Graph Writing - Column Graph:
» You should spend about 20 minutes on this task.
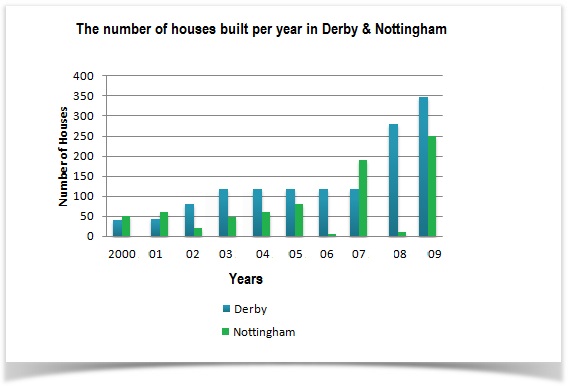
The diagram below shows the number of houses built per year in two cities, Derby and Nottingham, Between 2000 and 2009.
Write a report for a university lecturer describing the information shown below.
» Write at least 150 words.

Model Answer 1:
The bar chart compares the construction of new houses in two cities - Derby and Nottingham, from 2000 to 2009. Generally speaking, the number of new homes in these two cities increased steadily through the years and inhabitants of Derby end up building more abodes in the final year despite a considerable gap in the previous year.
As the data suggest, around 95 residences were built in these two cities in 2000 and 50 of them were established in Nottingham. In 2002, roughly 70 further houses came into existence in Derby which was considerably higher than the development of new abodes in Nottingham. This trend continued until 2005. Next year, almost no new houses were built in Nottingham but Derby witnessed the creation of almost 110 new homes. In 2007, a reverse case was obvious when around 190 brand new buildings were made in Nottingham compared to just over 100 in Derby. Building new homes in 2008 showed another anomaly when an ignorable number of new homes were developed in Nottingham against nearly 280 brand new houses in Derby. In the final year, 250 new dwellings were added to Nottingham city while almost 350 were developed for Derby residents.
Sample Answer 2:
The chart outlines the number of houses built annually in Derby and Nottingham cities from 2000 to 2009. Overall, more houses were built in Derby than Nottingham each year except in 2000, 2001 and 2007.
According to the bar graph, only 50 houses were built in Nottingham in 2000 where this number was around 45 in Derby. After two years, this trend changed and more houses were built in Derby than Nottingham. Until 2005, the trend remained almost the same and in 2005 more than 100 houses were built in Derby while less than 80 in Nottingham. Interestingly the number of houses constructed in Nottingham were very few (less than 10) in 2006 and 2008 while it was much higher in Derby. In 2007 a reverse trend could be observed where more than 190 dwellings were constructed in Nottingham compared to the only 110 houses in Derby. In the final year, 2009 more than 240 homes were developed in Derby while 250 in Nottingham.
In summary, over the time, the number of houses that were built in Derby increased almost in each year while this showed some anomaly in Nottingham where fewer houses were built than Derby, except in 2000, 2001 and 2007.

According to the diagram, initially, about 90 houses were built in 2000, 50 of which belonged to Nottingham. The number of new houses in Derby surged to over 100 after 3 years and remained roughly the same until 2007. On the other hand, the figure in Nottingham had dropped to around 20 in 2002 before increasing 3-fold in 2005, then dipped to almost zero a year later.
The unusual pattern in Nottingham continued as new houses in Nottingham almost reached 200 in the year 2007, which was about 50% more than in Derby. Afterwards, the number in Nottingham decreased dramatically to become approximately 10; however, in 2009, the figure peaked at 250. Regarding Derby, the city's new houses became thrice after 2 years, reaching a high of 350 by the end of the given period.
As is evident, the new buildings in Derby gradually increased while Nottingham had enormous changes and fluctuations in terms of new constructions of buildings, sometimes spouted and the other times slumped.
As is presented as a census of a perusal, in 2000 and 2001 the proportion of new building construction in Nottingham was more than that of Derby. But this amount plunged to 20 from 60 for this area and on the contrary, the number of newly built building in Derby lunged and reached 80 in 2002. The new buildings in Nottingham increased monotonously until 2005 and met 80 but after a remarkable downfall, it reached to near 1 in 2006 and again swelled up rapidly and passed the derby’s new construction number in 2007. This scenario and severe fluctuations continued until 2009 and reached to 250 new houses. The number of new houses in Derby was stable from 2003 till 2007, and after 2 mutations, reached to 350 in 2009 as the summit. The new building construction in both cities increased more in the later years.
Report