Graph Writing # 66 - Consumption of food in 2008 in China and India
- Details
- Last Updated: Sunday, 26 July 2020 19:06
- Written by IELTS Mentor
- Hits: 204399
IELTS Academic Writing Task 1/ Graph Writing - Pie Charts:
» You should spend about 20 minutes on this task.
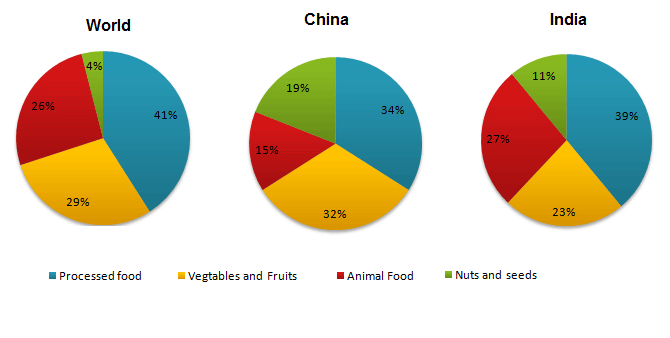
The pie charts show the average consumption of food in the world in 2008 compared to two countries; China and India.
Write a report to a university lecturer describing the data.
» Write at least 150 words
Model Answer 1:
The pie charts outline the types of food people ate in 2008 compared with the consumption of these items in China and India in the same year. As a general trend, processed food was the main energy source for the world population and consumption of nuts and seeds in China and India was significantly higher than the world average.
As the illustration suggests, just over 40% diet of the global population came from processed food in 2008 which was slightly greater than that of India and exactly 7% higher than that of China. Vegetables and fruits provided somewhat one-third dietary requirements of the Chinese citizens and precisely 23% of Indians. The world average for fruit and vegetable consumption was just below 30%.
Interestingly, nuts and seeds accounted for almost one-fifth food stocks for the Chinese, a noticeably higher rate than the world standard. Nearly one-tenth food rations in India was from nuts and seeds. Food derived from animals supplied more than one-fourth Indian dietary provisions, which was 12% higher than that of China and almost the same of the world’s dietary demands.
Sample Answer 2:
The pie charts exhibit four types of food consumptions of the world with that of China and India in 2008. Overall, processed food items were consumed at the highest percentage than other food items and Chinese citizens were the highest consumer of nuts and seeds while Indians primarily relied on processed food and animal food.
According to the pie charts, people of the world, as well as the China and India, ate processed food more than any other food item. People ate almost 41% processed food in the world in 2008. This percentage was higher in India than China. On an average, 29% vegetable and fruits were absorbed by the world population while this percentage was 32% in China and 23% in India. Foods from animals were the third largest consumed item and Indian ate more than the world average. Nuts and seeds consumed in India and China were much higher than the world average.
It is worth noticing that Indian ate more animal foods than Chinese did while Chinese devoured more vegetables, fruits and seeds than Indians. On an average, Indian population consumed more animal foods and seeds items than the world population while Chinese people ate more vegetable and seeds than the rest of the world.

Report