Graph Writing # 82 - Differences in wheat exports over three different areas
- Details
- Last Updated: Tuesday, 28 July 2020 11:54
- Written by IELTS Mentor
- Hits: 194131
IELTS Academic Writing Task 1/ Graph Writing - Line Graph:
» You should spend about 20 minutes on this task.
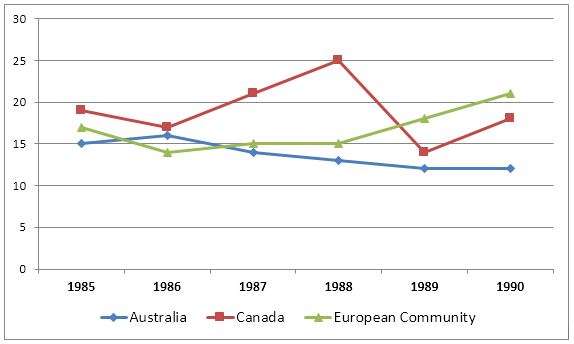
The graph below shows the differences in wheat exports over three different areas.
Write a report for a university lecturer describing the information shown below.
» Write at least 150 words.
Wheat Exports from 1985 to 1990 (in million tonnes)
Sample Answer 1:
The given line graph compares the wheat exports over three different parts of the world namely Australia, Canada and the European Community from 1985 to 1990. As is presented in the graph, the wheat export in Australia decreased over time while the export in Canada and European countries increased with some fluctuations.
According to the graph, around 15 to 20 million tons of wheat was exported to Australia, Canada and the European community. This amount decreased slightly in 1986 reaching around 15 million tons and from that point, the export quantity in Australia kept on decreasing and reached just over 10 million tons in 1990. In the meantime, the amount increased sharply in Canada until 1988 and then there was a quick decline and finally, it reached around 19 million tons in 1990. Finally, the wheat export in the European Community increased gradually over the years and reached over 20 million tons in 1990.
Sample Answer 2:
The line graph elucidates the wheat exportation of three regions, namely Canada, Australia and European community from 1985 to 1990. As can be seen, Canada was the leader in wheat trading till 1988 and after that, the European Community became the leading wheat exporter among the given regions.
Initially, in 1985, Canada exported the highest quantity of wheat which was approximately 19 million tonnes. The wheat export in this year by the European Community was about 17 million tonnes and finally, 15 million tonnes of wheat was traded by Australia in this year. Next year, only Australia managed to export more wheat than the previous year's quantity, while it declined in the case of Canada and the European Community. In the next two years (1987 and 1988) the amount of wheat exported by Canada rocketed and reached to 25 million tonnes while it was 15 million tonnes for the European Community and far less for Australia. In 1989, the amount of wheat export by Canada dropped very sharply while it was quite the opposite for the European Community. The final year's export figure shows that European Community shipped just over 20 million tonnes of wheat compared to Canada's just below 20 million tonnes. In this year Australia consigned just over 10 million tonnes of wheat.
[Written by Max Frame]
Model Answer 3:
The line graph compares the quantity of wheat Australia, Canada, and the European Community exported between 1985 and 1990. Overall, the European Union’s wheat shipping increased over the time while Australia experienced a downward trend in its wheat trading. Although wheat exports of the three given areas have fluctuated, Canada had the most noticeable oscillations throughout the given period.
The European Union exported approximately 17.5 million tonnes of wheat in 1985 and the export fell below 15 million tonnes in the following year. Then, it increased to 15 million tonnes in the subsequent year and remained steady in 1988. EU’s wheat export surged in the next two years and in 1990 their wheat export was more than 20 million tonnes.
On the other hand, Australia’s wheat export in 1985 was the lowest, 15 million tonnes, among the given three regions. In the year that followed, the import improved with at least 1 million tonnes before it continuously declined in the subsequent years, hitting the lowest wheat export figure as little as 12 million tonnes in 1990.
Canada’s wheat export was the highest of the three given regions in 1985 with nearly 20 million tonnes. Next year, it decreased to about 17 million tonnes before it significantly increased in the following two years, reaching 25 million tonnes in 1988, the highest. However, in 1989, it plunged to around 5 million tones below its initial wheat exports figure in 1985 and settled to 20 million tones and the end of the period.
[Written by - Lance Calderon]
Sample Answer 4:
The line graph illustrates changes in wheat export by Australia, Canada, and the European Community within a five-year period - from 1985 to 1990. Overall, what stands out of the graph is that wheat export by the European Community increased over the period, whereas Australia witnessed a gradual decrease in the period considered. Although wheat exports of the three areas fluctuated, Canada had the highest oscillations throughout the interim.
One of the first things to note is that Canada was the country whose wheat exportation comprised nearly 20 million tons in 1985. In the following year, the rate of export fell and then quickly recovered reaching a peak of 25 million tons in 1988. However, this figure fluctuated over the years, finishing surprisingly the same as it was at the starting point.
European Community initially exported less than Canada, but its outcome turned out more than the other two countries at the final point- over 20 tons. In contrast to the other two areas, Australia exported 15 tons in 1985 and saw a slight decrease over the period except in 1986.
[Writtne by - Nilufar Makhsudova]

Overall, the wheat export by Australia declined over the period whereas Canada and the European community's exports increased with some fluctuations.
As the graph shows, Australia's wheat exports started from 15 million tons in 1985 followed by a small increase. Then, it gradually declined until it fell to just over 11 million tons in 1990. Regarding Canada's export - they shipped around 19 million tons of wheat in 1985, which dropped to approximately 16 million tons next year. This figure witnessed considerable growth till 1988. Afterwards, their export figure declined steadily to below 15 million tons, which again rose to around 17 million tons in 1990.
There was an increase in the European Community's export of wheat. the exports rose over six years with some fluctuations. Approximately, 16 million tons of wheat were exported in 1985 with a small decline in 1986. It remained static from 1987 to 1988. Then, it crossed 20 million tons in 1990.
Overall, the European community experienced a growing trend in shipping wheat to other countries, whereas the opposite was true for Australia. And, Canada's wheat export figures exhibited a fluctuating pattern throughout the period.
As is shown in the graph, Canada exported 20 million tonnes of wheat in 1985 which was higher than the other two regions. Although it decreased slightly in the following year, a steady increase can be noticed from 1986 to 1988, reaching a peak of exactly 25 million tonnes, which was by far the highest quantity of wheat export compared to other countries. This figure then plummeted to about 14 million tonnes. However, in the final year, Canadians managed to raise its export to around 17 million tonnes.
Regarding the export of Australia and the European Community, both had exported roughly 15 million tonnes in 1985. Despite a rise in the following year, the former saw a declining trend throughout the period before hitting 12 million tonnes in 1990. The latter, nevertheless, experienced a slight fall in 1986 until levelling off at 15 million and then surging rapidly to reach a peak of about 21 million tonnes in the final year.
The graph below shows the differences in wheat exports over three different areas.
Write a report for a university lecturer describing the information shown below.
Answer: The line graph shows the wheat export in three different parts of the word between 1985 and 1990.
Overall, wheat export from Australia decreased over time while the wheat exports by the European community had increased over the period. Furthermore, Canada's export after a rise and a fall remained at a stable level.
In 1985, Canada exported about 18 million tons of wheat and was the highest wheat exporter this year. But wheat export of Canada decreased gradually in 1986 then increased to 25 million tons in three years. After that, this amount decreased sharply to 14 million tons in 1989, and by 1990 returned to its initial stage.
European community's export, on the other hand, fluctuated during the 5 years period. It exported 17 million tons of wheat in 1985 and after a year, it decreased to 14 million tons. Finally, this quantity went up to 15 million tons. Between 1987 and 1988, it stayed constant and rose gradually to 21 tons in 1990. Finally, Australia's wheat export had a rise of 3 million tons at first year but after that, it dropped to 12 million tons until 1990.
Overall, wheat export from these three regions showed some fluctuations and in later years, the European community exported the highest quantity of wheat.
Canda exported around 19 million tons of wheat in 1985 and it reached to exactly 25 million tons in 1988. With a shard drop next year, Canada's wheat export amounted for roughly 18 million tons in 1990. Again, the European Union ended up as the top wheat exporter in 1990 despite the second position early in 1985. It topped the list with its approximately 22 million tons export which was as low as just 13.5 million tons in 1986. Finally, Australia's wheat export was 15 million tons in 1985 and with a gradual drop throughout the period, it reached just over 11 million in 1990 which was lowest among the three in this year.
Overall, the European community's wheat export developed during the time and had the minimum fluctuations, but Canada exported the highest quantity of wheat in a year which was 1988.
As is presented as a census of a perusal, Australia, Canada and the European community exported 15, 17 and 19 million tons of wheat, respectively in 1985. The volume of Australian export increased slightly in 1986 and after that, this volume declined steadily with a gentle slope and reached 11 million tons in 1990 as a nadir. On the other hand, Canada’s wheat export in comparison was less in 1986 but this volume swelled up rapidly and reached to 25 million as the summit in 1988 and suddenly plunged in 1989 and rebound to nearly 20 million tons in 1990. Similarly, initial wheat export by the European community decreased negligibly and oscillated near 15 million tons until 1988. After that, it plunged remarkably and reached 22 million tons in 1990.
Overall, Canada witnessed the highest changes in its wheat export during the given period and Australia managed the minimum export in later years.
As is presented as a census of a perusal in the provided illustration, in 1985 these amounts were 19, 17 and 15 million for Canada, the European community and Australia respectively. These proportions decreased for Canada and the European community in 1986 but in Australia, it increased. After that, wheat export by Australia declined and reached 11 million in 1990. Canadian export witnessed two big fluctuations - first, it swelled up rapidly and met 25 million as the summit in 1988 and second, it plunged to under 15 million in one year and then rocketed on and received to 19 million in 1990.
In another scenario for the European community, it was almost the same without any noticeable changes until 1988. B0ut after that, its ratio grew up and achieve 22 million tones in 1990.
Report