Graph Writing # 84 - Favourite Pastimes in different countries
- Details
- Last Updated: Tuesday, 28 July 2020 11:55
- Written by IELTS Mentor
- Hits: 82795
IELTS Academic Writing Task 1/ Graph Writing - Table:
» You should spend about 20 minutes on this task.
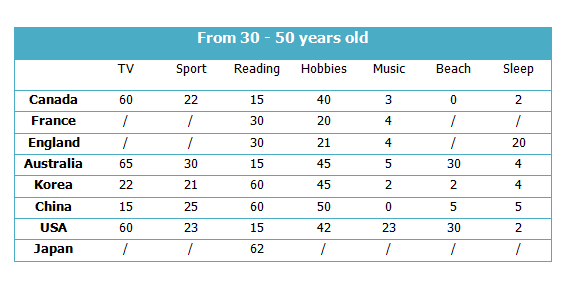
The table below gives information about favourite pastimes in different countries.
Summarise the information by selecting and reporting the main features, and make comparisons where relevant.
» Write at least 150 words.
Sample Answer:
The given table data shows the favourite pastime activities of 30 to 50 years old people’s in eight different countries. As is observed from the provided information, watching Television is the most popular leisure activity of the majority of the people and based on countries, the interests vary to a great deal.
According to the given figures, Watching TV is the most popular pastime activity among the 30 to 50 years old people in Canada, Australia and the USA. The people of these three countries who are between 30 to 50 years old spent their 60-65 of past time watching TV. Korean, Japanese and Chinese people of this age group prefer to read books while listening music is most popular among the people of this age group in the USA. Participating in sports is higher in Korea, China, Australia, USA, and Canada than other countries. Interestingly Sleeping and going to the beach are two least preferred activities and English citizens of this age group spend their pastime mostly by reading, sleeping and spending time in their hobbies. No data apart from reading is given for the Japanese people and French people prefer to read than any other activity. Sleeping is least popular in Canada and the USA where only 2% people in this age group spend their leisure time sleeping.

Overall, it was good.
Report