Graph Writing # 90 - Demand for electricity in England during winter and summer
- Details
- Last Updated: Wednesday, 15 June 2022 15:04
- Written by IELTS Mentor
- Hits: 285950
IELTS Academic Writing Task 1/ Graph Writing - Line Graph + Pie Chart:
» You should spend about 20 minutes on this task.
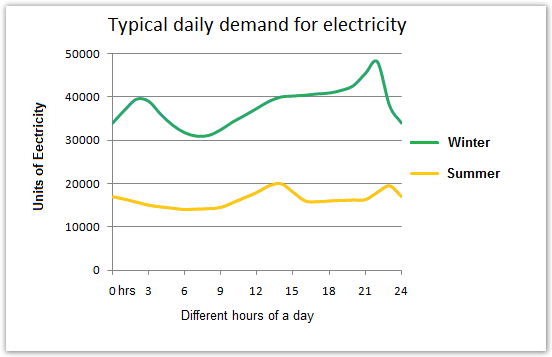
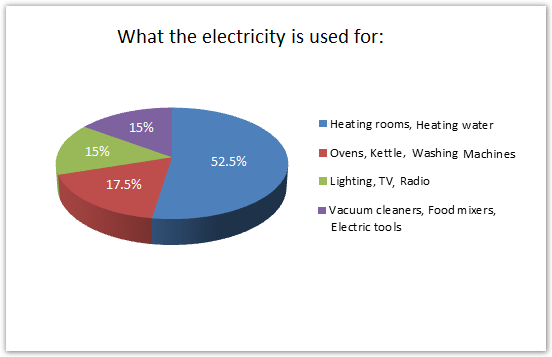
The graph below shows the demand for electricity in England during typical days in winter and summer. The pie chart shows how electricity is used in an average English home.
Summarise the information by selecting and reporting the main features and make comparisons where relevant.
» You should write at least 150 words.
Sample Answer 1:
The illustrations show the electricity demand in England in a typical day in winter and summer and also how people use this electricity. According to the first line graph, we can see that the electricity demand in winter is much higher than the demand in summer in England.
In a typical day, the electricity demand in winter season is around 35,000 units and it is around 18,000 units in the summer season. Again the demand for the electricity varies on several hours of the day and the demand from 6:00 to 9:00 am is lesser than the demand in other hours of the day. During the winter the demand is highest from 21:00 to 23:00 and during summer the demand is highest from 13:00 to 14:00 hours.
Based on the pie chart we can infer that the room heating and water heating is the main purpose people consume the electricity in England. The demand for washing machine, kettle and ovens consume around 18% of total electricity consumed and two other categories consume 15% electricity each. These two other categories which consume 30% of total electricity include light, TV, Radio, vacuum cleaner, food mixer and other electric told and devices.
Model Answer 2:
The presented graph illustrates the electricity requisition in England during two different seasons, winter and summer. Meanwhile, the pie chart demonstrates how the electricity is utilised daily and to what quantity.
In general, both in winter and summer, the electricity demand rises up from around 9:00 am to about 23:00 pm and the electricity in mainly spent for heating room and water.
Looking at the detail, the electricity demand in summer is reckoned between 10,000 – 20,000 units. It goes to around 12,000 before 9 am and slightly increases to around 20,000 at 14 pm and relatively fluctuates until the rest of the day. However, in winter, the electricity requisition sets about 35,000 units at 00 am and gradually spikes before it actually rises at 9 am and keeps the level swells until around 45,000 units at 23 pm.
Meanwhile, due to utilisation and quantity, heating room and water require the vast majority, 52%, of electricity using. This high proportion is related to the high electricity demand for these two appliances during winter. Whereas other kitchen and electronic devices, vacuum cleaners, food mixers and electronic tools amass lower proportion, 48%, than heating rooms and water.
[Written by - Linda ]
Sample Answer 3:
The given line graph illustrates the demands for electricity during normal days of summer and winter in England, while the pie chart describes how an average household consumes electricity in England.
The line graph exhibits that electricity demand in winter is significantly higher than that in summer. Besides, the pie chart shows that more than half of the electricity is consumed for the purpose of heating rooms and water.
The given illustration shows that in winter, electricity demand in England rise up to almost 48,000 units and drops to nearly 30,000 units. It is generally observed that the demand increases after the evening time. While in summer, the electricity demand rises up to 20,000 units in the noon time and drops to almost 12,000 in the early morning.
The given pie chart demonstrates that more than half of the electricity is utilised for the purpose of heating rooms and water which is 52%. The second major proportion of electricity, 18%, is utilised for using ovens, kettles and washing machines. Lighting, TV and radio utilise 15% electricity while the remaining 15% goes for the vacuum cleaner, food mixers, and electric tools.
[Written by - Zafar]
Model Answer 4:
The line graph compares the electricity demand in England during a regular day in winter and in summer while the pie chart shows the usages of the electricity. Generally speaking, during the winter season, the demand for electricity was much higher than that of the summer in England.
During a typical day during winter, the average electricity requirement was around 35 thousand units while this demand was about 16 thousand units during a summer day. Again the electricity requirement fluctuates during the different hours of a typical day and this demand seems lowest in early morning and highest at late night.
Based on the pie chart data it can be clearly seen that room and water heating require more than half of the total electricity usages. Washing machines, kettle and ovens consume around 18% electricity while lighting houses, watching TV and listening to radio require 15% of the total electricity. Finally, the same percentage, 15% of electricity, is consumed by English people for running vacuum cleaners, food mixers and electric devices.
[Written by - Anidoritrang ]

From an overall perspective, the electricity consumed in the winter season is higher than the electricity consumption in the summer season in the United Kingdom. Moreover, heating rooms and other heating appliances drain almost half of the energy demand.
According to the line graph, there are fluctuations in the electricity consumption at different hours of a day in both seasons. In the winter season, when more heating appliances are in use, the consumption per hour starts and ends with a unit of around 30,000, with fluctuations throughout the day. The highest demand for electricity during a winter day seems like at around 9 and 10 o'clock at night. Similarly, in the summer season, the unit of electricity demand is the same at the start and the end of the day with a demand of about 14 to 16 thousand units per hour. During the summer season, English people consume the highest electric energy (20 thousand units per hour) during noontime, from around 2:00 to 3:00 pm.
The pie chart accounts for the electricity consumed by different electrical appliances. Heating appliances consume a notable share of 52%. Further, 17.5% of electricity is consumed by ovens, kettles and washing machines, and lastly, households like lightings, TV’s, radios, vacuum cleaners, food mixers have similar consumption rates.
The presented graph indicates the electricity requisition in England during in typical of day summer and winter. It be see that in winter people much higher than the demand of summer. In the meantime, the pie chart describes how average daily family consumes for.
Looking in detail, during wintertime the electricity demand dramatically intensification s from around 8:00 am to about 22:00 pm, electrical energy mainly spent around 30000 Units to nearby 50000 units in ordinary. In contrast, the energy in other seasonal summer is rapid changes between 17000 items to a little increases about 13:00pm round 20000 items and the declined to normal.
Based on pie chart illustrates proportion of energy is applied for the main purpose heating room and water vast majority in 52%. Obviously, the high percentage of the demand of Ovens, kettles and washing machines used 18% and lighting, TV, Radio. In compare with, the requiring of vacuum cleaners, food mixers and electronic devices utilized total 30%.
To begin with, the bar graph shows that each hour in summer requires between 15 and 20 thousand units of electricity, while the figure regarding winter stands from 31 to 48 thousand. In both seasons, the lowest demand is recorded at around 8 am. On the other hand, the highest electricity consumptions can be seen at 10 pm in winter and both at around 2 and 11 pm in summer. It is also worth noticing that from 1 pm to 11 pm in winter, the number of units of electricity used soars above 40 thousand.
As for the pie chart, over 50% of electricity demand is utilized for heating room and water. Additionally, Britons use as much energy for ovens, kettles and washing machines as for entertainment and lighting. The remaining 18% goes to electric tools, such as food mixers and vacuum cleaners.
Overall, the highest electricity is being consumed during winter, making heating rooms and water heaters in demand during the cold season.
In the first graph, it is evident that nearly 40,000 units of electricity are being consumed in the first 3 hours. At 6:00, it fluctuates to 31 thousand units then continue to rise until 21:00 reaching 48 thousand units. Meanwhile, in the summer season, England's demand for electricity demand reduced to half the consumption during the cold season throughout the day. In addition, 52.5% of electricity is being utilized by English homes using heating rooms and water heaters. The use of kettles, ovens and washing machines need 17.5% of total electricity consumption. The remaining 30% of the electricity is utilized for lighting, TV, radio and other home appliances.
It is clear that the electricity demand during the winter is approximately twice than that of the summer in the UK. Throughout the year, heating rooms and heating water consume just over half of the total electricity consumption in English homes.
During the winter, electricity demand in the UK is around 35 thousand units just after mid-night. It reached to 4 thousand units at 3:00 in the morning and drops significantly during the day. The demand kept on increasing as the day ends and reached to around 48 thousand, the highest demand in a day, at around 10:00 pm. On the contrary, during summer, electricity demand is almost half than that of the winter and just after mind-night, it stands at about 18 thousand units. It reaches to 2000 unit, the highest point, at 3:00 pm and 10:00 pm.
As the pie chart suggests, more than half of the electricity in the UK household is used for heating rooms and heating water. Light, TV and radio consume 15% of the electricity and the same amount of electricity is required for vacuum cleaners, food mixers, and other electric devices. Finally, 18% of electricity is used for ovens, kettles and washing machines.
Overall, electricity demand in the UK is much higher during winter and heating room and heating water consumes a large portion of electricity in the UK.
As is provided as a census of a perusal in the given trend illustrates electricity demand fluctuates between 15000 and 20000 units in summer but in winter this change is intensified and alters in 30000 and 48000 unit range. Moreover, electricity consumption meets 48000 units as the summit at 21:00 during winter.
The pie chart depicts 4 different reasons for electricity usages and their volume. The proportion of electricity used for vacuum cleaners and lighting are equivalent but the heating room and water devote the most amount of its consumption with 52%. Besides, ovens and kitchen equipment use 18% of whole residential demands.
Report