Graph Writing # 89 - The graph shows the unemployment rates in the US and Japan
- Details
- Last Updated: Monday, 30 May 2022 20:13
- Written by IELTS Mentor
- Hits: 246151
IELTS Academic Writing Task 1/ Graph Writing - Line Graph:
» You should spend about 20 minutes on this task.
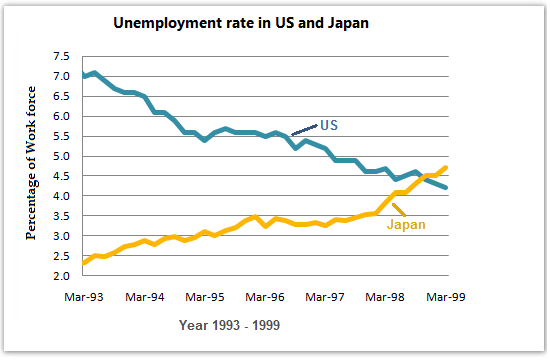
The graph below shows the unemployment rates in the US and Japan between March 1993 and March 1999.
Write a report for a university lecturer describing the information shown below.
» You should write at least 150 words.
Model Answer 1:
The line graph compares the proportion of unemployed people in the US and Japan through the period from March 1993 to March 1999.
It is obvious that the unemployment rates of these two countries changed oppositely - while it decreased in the USA, it increased in Japan.
The percentage of the US tended to decrease over the years. However, at the same time, unfortunately, Japan witnessed the rapid growth in the rates. Nevertheless, in 1999, both nations almost had the same percentage, which means the lowest figures of the US were equal to the highest ones of Japan.
In March 1993, the proportion of unemployment in the US was a bit off 7% whereas that of Japan was about 2.5%. It was marked in 1998 when Japan's rate reached the highest point of approximately 5.2%. The contradiction happened to the US: its rate went to the lowest of 4.8%.
Although the processes of figures changing of these countries were totally opposite, the last numbers, amazingly, turned out to be extremely close. In March 1999, the rates of unemployment in the USA and Japan stood still at about 5.1% and 4.9% respectively.
[ Written by - Ha Nguyen Nguyen ]
Sample Answer 2:
The given line graph compares the unemployment rates in the USA and Japan from March 1993 to March 1999.
As an overall trend, the USA succeeded to decrease its unemployment rate over the time while the scenario was completely reverse in Japan despite its initial ignorable rate of unemployment.
As can be seen from the given illustration, the unemployment rate in the USA was just over 7% in March 1993 while it was less than 2.5% in Japan. However, this rate kept on decreasing in the USA while it went up in Japan. In two years, the percentage of jobless Americans fall to just below 5.5% while it increased in Japan and stood at 3.0% at the same time. The opposite trend of the line graph depicts that unemployment rate in the USA gradually declined while increased in the case of Japan. The rates of joblessness in these two countries intersected between March 1998 and March 1999 when the unemployment rate in both countries was just about 4.5%. At the end of 1998, the percentage of unemployment among the Americans became less than that of Japan. The data presents that jobless people’s percentage in the USA was just above 4.0 in 1999 while this rate in Japan reached to over 4.5% which was more than double than the initial rate of their unemployment.
[Written by - David Smith]
Sample Answer 3:
The given graph compares the unemployment rates in Japan and the USA from 1993 to 1999. As is observed from the given graph, initially in 1993, USA has a higher unemployment rate than it was in Japan but in few years, the USA managed to control this rate and got in a better position than that of Japan.
According to the line graphs, the unemployment rate in the USA was over 7% in 1993 and over time this rate kept on decreasing. Finally, in 1999, the unemployment rate in the USA decreased to just over 4.5% which shows the improvement the USA had been able to achieve. On the contrary, in 1993, Japan had about 2% unemployment rate but that kept on increasing over the year and after 6 years it grew to just over 4.5%. Japanese job market showed a completely opposite trend than the USA job market.
In summary, the USA managed to control the unemployment rate better than Japan did for the given period though initially, Japan had less unemployment problem than the USA.
Sample Answer 4:
The given line graph compares the unemployment rate in two countries: US and Japan from 1993 to 1999. As is observed from given graph, initially unemployment rate in the US was much higher than it was in Japan. But after a specific gap of years, the US managed to resolve the problem of crucial unemployment. Interestingly, after few years unemployment rate in Japan magnified significantly.
As is presented in above line graph, it can be seen clearly, in 1993 unemployment rate in the US was exactly 7.0 percent and after six years period, it slumped to approximately 4.5 percent in 1999. On contrary, in 1993 Japan was full of prosperity and its unemployment rate was around 2.5 percent. Unfortunately, after six years situation changed completely and the unemployment rate in Japan surged over 4.5 percent respectively. Interestingly, Japan job market showed opposite trend than US job market.
Ultimately, US managed to overcome the problematic situation of unemployment in 1999. Apart from this unemployment in Japan kept on soaring year by year and reached to 4.5 percent in 1999. Finally, unemployment issue of Japan became severe compared to the USA.
[ Written by - Faisal Ali ]
Model Answer 5:
The diagram gives some statistical information about the unemployment scenario in Japan and the United States between 1993 and 1999. Generally speaking, these two countries showed a contrasting trend in their unemployment ratio between March, 93 and March, 99.
In 1993, 2.5% Japanese could not find a suitable job which represents a 97.5% employment rate in this country. At that time, 7.0% of US citizens were unemployed. Over the time unemployment rate in Japan gradually increased while it actually decreased in the USA. After three years, March 1996 to be exact, unemployed Japanese increased by 1.5% and decreased by the same ratio in the USA. This pattern continues and in the Mid-98, the unemployment rates in these two countries intersected at exactly 4.5%. Next year, the USA managed to arrange jobs for more unemployed citizens and thus decreased this rate further while it went higher in Japan. Interestingly, the unemployment ratio in the USA dropped significantly while increased in Japan over the period. In 1999, just over 4% American's were jobless while more than 4.5% Japanese did not have a job.
[ Written by - Ahmet ]

Overall, the unemployment trends in the US and Japan were antagonistic, as the US started to manage their job scars from the initial time and lowered them through the period. While in Japan, the unemployment problem followed the rising trend.
In March 1993, the proportion of jobless American manpower was about 7%. Then it started to fall significantly with fluctuations till the end of the year 1995. It went in sideways on decreasing order for Japan only 2.5% of the workforce were employed in 1993 but it increased to nearly double in mid-1998. Then it also followed the same trend as the US in the years 1998 and 1999.
In contrast, Americans were able to cope with their unemployment problems as they managed to drop it to half but the Japanese could not manage their job scarcity problem as it was rising up to the least of the American unemployment portion.
A glance at the graph reveals that the US had witnessed a significant downward trend in unemployment from the beginning of the period to the end. Meanwhile, the overall percentage of unemployed Japanese increased impressively over the span of years.
Now, turning to the details, in March 1993, approximately 7.0 per cent of Americans were unemployed. From 1993 to 1995, there was a sharp decline in unemployment, however from 1995 to 1999, the percentage of US citizens; joblessness fluctuated and dropped considerably to almost 4%.
Starting at nearly 2.5 per cent, the ratio of unemployed Japanese showed an upward trend starting from 1993. There was a progressive fluctuation until 1998. Then, the number of people without work increased significantly from 3.5 to 4.0 per cent. Afterwards, from the end of 1998 up to the end of 1999, Japan witnessed rapid growth, exceeding the percentage of unemployed in the US, which peaked at roughly 5.0 per cent in 1999.
Generally speaking, there was an inverse trend between the unemployment rates in the USA and Japan, while the unemployment rate in the US decreased steadily during the studied period, the rate in Japan rose constantly.
In March 1993, roughly 7 out of a hundred Americans were jobless while this rate was less than 2.5% in Japan. The rate of unemployment in the USA afterwards kept on decreasing steadily while it was completely opposite in Japan. After 3 years, more than 3% of the Japanese population was unemployed while it was still more than 5% in the US. However, this rate intersected during August 1998 when both countries witnessed around 4.5% of jobless people. The data trend clearly outlines that the unemployment rate in the USA decreased over time while it went higher in Japan.
Overall, the unemployment rate in the USA decreased over the period while japan’s joblessness increased.
As can be seen from the graph, in 1993, the jobless people in the US stood at 7% and then dropped moderately to 5.5% in March 1995. However, between March 95 and March 96, the rate remained almost the same. Next, this rate declined slightly and reach nearly 5.2% between March 95 and March 96. Finally, it finished the period with a slight fall to 4.1% during March 99. As for Japan, the percentage of unemployed citizens began at a lower point, about 2.4%, and then climbed slowly to 3.5% in March 95. However, two years later, it remained almost unchanged before the unemployment rates increased gradually at 4.7% in March 99. At that time the unemployment rate in Japan crossed the unemployment rate in the USA.
As can be seen, the percentage of jobless people in the US was higher than that of Japan from 1993 to 1998 and the number was equal in March 1999. The figure also shows that the rate of unemployment in the US reduced but Japan’s unemployed rate rose over until the last period.
In March 1993, the rate of unemployment in Japan was 2.5% and it went up to 4% in 1994. Fluctuations took place from 1994 to 1995 and Japan’s unemployment rate increased until March 1999 by 5.0%. However, unemployment in the US was 7% in 1993 but it reduced by 2 per cent in 1996-97. It also remained steady between 1997 and 1998. On the other hands, both the US and Japan had around 5.0% unemployment in 1999.
Overall, the chart indicates that the proportion of unemployment in the USA decreased at the end of the period and the proportion of unemployment increased in Japan.
It is observed that the unemployment rates of these two countries changed oppositely. Between 1993 and 1997, the US unemployment rate showed a downward trend with rapid fluctuations, whereas the unemployment rate in Japan indicated an upward trend. In March 1993, the US had 7 per cent unemployment rate in comparison with about 2.5 per cent in Japan. There was a rapid decline in the USA's unemployment rate between 1993 and 1995, from 7 per cent to just over 5.5 per cent. From 1995 until the end of the period, the percentage of unemployment decreased slightly and it reached approximately 4 per cent in the USA. The percentage of unemployment in Japan started at about 2.5 per cent and that rose steadily above 4 per cent. At the end of the period, it peaked at over 4.5 per cent. Though initially, the unemployment rate was higher in the USA than that of Japan, the USA managed to decrease this while it was opposite for the unemployment scenario in Japan.
Report