Graph Writing # 100 - Why agricultural land becomes less productive
- Details
- Last Updated: Thursday, 04 August 2022 00:38
- Written by IELTS Mentor
- Hits: 424376
IELTS Academic Writing Task 1/ Graph Writing - Pie Chart + Table:
» You should spend about 20 minutes on this task.
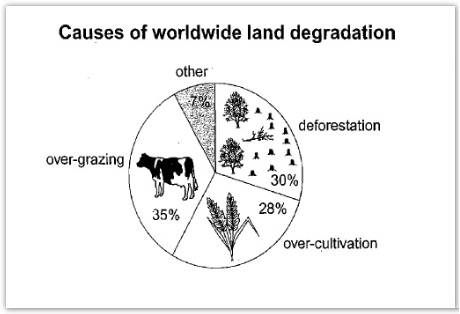
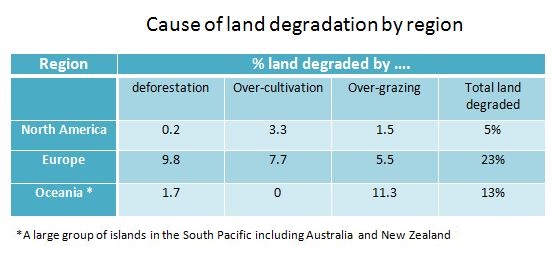
The pie chart below shows the main reasons why agricultural land becomes less productive. The table shows how these causes affected three regions of the world during the 1990s.
Summarise the information by selecting and reporting the main features, and make comparisons where relevant.
» Write at least 150 words.
Sample Answer 1:
The pie chart indicates the factors that negatively affect the productivity of agricultural lands worldwide while the table data illustrates the percentage of land degradation in three main regions due to those factors mentioned.
From the pie chart, it can be seen that the major factor that causes the worldwide land degradation is over-grazing. 35% of agricultural lands worldwide become less productive due to a single factor - over-grazing. Deforestation is accounted for 30% degradation of cultivable land while over-cultivation results 28% land degradation. All other minor reasons are categorised as ‘other’ and constituted 7% loss of land fertility.
The given table data shows the percentages of agricultural land degradation in three regions during the 1990s, namely - North America, Europe, and Oceania. Oceania comprised many islands in the South Pacific area including New Zealand and Australia. The analysis shows that highest percentage of land degradation, 23%, occurred in Europe in the 1990s. This is followed by Oceania and North America where these percentages were 13% and 5% respectively. The most striking feature was that over-cultivation had zero impact in Oceania as it was mostly affected by over-grazing.
Sample Answer 2:
The given picture contains two charts, one pie chart and another table chart. As is observed from the pie chart, the main reason for less productivity is overgrazing of animals which constitutes 35%. Another big reason of land degradation is deforestation which holds 30% of the total. Over cultivation also affects the production of land which constitutes 28% while other reasons of land degradation are remaining 7%. As a result, the biggest reason of land degradation is overgrazing of animals in agricultural land.
According to the given table, we will analyse what are main causes of less production of land in different regions and how they affect the lands' production. As it can be seen clearly, that Europe is badly degraded by 23%. Europe is degraded by deforestation by 9.8% while 7.7% is affected due to over cultivation and finally, 5.5% degraded by overgrazing. Europe is affected badly by 23% while North America holds 5% and Oceania by 13%.
In conclusion, Europe is badly affected by these factors in all of the regions.
[ Written by - Faisal Ali ]
Sample Answer 3:
The given pie chart and table depict the significant causes of less productivity of agricultural land in three parts of the world in the 1990s. As is observed from the pie chart, the main reason for land degradation around the globe is due to over-grazing. It can be clearly seen from the table that Europe had the highest percentage of total land degraded than the other two regions.
Over-grazing is the main cause of worldwide land degradation which accounted for 35%. It is followed closely by deforestation which is 5% less than overgrazing by herbivores. The third reason why agricultural land degraded is caused by over-cultivation, accounted for 28%. The non-specific reason which is categorised as ‘other’ stood at 7%.
Europe has the highest percentage of land degraded which is 23% in comparison with Oceania which consists of the huge group of islands in the South Pacific including Australia and New Zealand (13%) and North America (5%). In Europe, the most detrimental cause of land degradation is deforestation by human beings which stood at 9.8%, whereas in Oceania, it is caused mainly by over-grazing which accounted for 11.3% than deforestation (1.7%). Over-cultivation did not contribute to the cause of land degradation in Oceania but it was the main reason that led North America to face the land degradation problem, which accounted for 3.3%.
[ Written by - Lee Wing Qeen ]
Sample Answer 4:
The pie chart below is divided into four different sections, illustrates the main reasons why agricultural land degrades around the world, while the table compares the degradation by regions, including North America, Europe and the Oceania, during the 1990s.
The predominant reason for land degradation would be over-grazing, taking up a percentage of 35 while deforestation fell into the second main reason with only five percent behind. Over-cultivation is the third major cause of the agricultural land to degrade. Each of the three reasons takes up roughly the similar equation while the other factors only cover 7 percent in the chart.
In Europe, the degradation is the worst in comparison to the other two regions, having the majority of the land degraded from the result of deforestation. Oceania has the total degradation of 13 percent with two main reasons that are responsible for the less productive agricultural land, including over-grazing and deforestation. Over-cultivation, however, has none effect toward the land in Oceania according to the table.
North America has the least degradation in the lands in the table below. It indicates that the land degraded in only five percent in the 1990s with the main cause of over-cultivation, taking up the percentage of 3.3 of the total degradation of 5 percent.
[ Written by - Chen Emma ]
Sample Answer 5:
The provided pie charts have four sections, each illustrates the reason of farmland degradation. However, the given table shows the effect of these causes on agricultural lands in three parts of world namely NorthAmerica, Europe and Oceania during the 1990s.
As is presented in the pie chart, overgrazing and deforestation are the predominant reasons for losing the productivity of lands which together contribute to 65%. Next, man-made activities such as over-cultivation are responsible for degradation up to 28% which is almost 4 times larger than other factors.
According to data given in the table, In 19990, farmland of Europe degraded to the much extent (23 percent land degraded) as compared to other regions, the cause behind this was deforestation. About 10% land lost productivity because of deforestation which is 5 times greater than Oceania. However, deforestation in North America was observed very less only 0.2percent. Interestingly, In 1990, over cultivation had no effect on islands in the South Pacific. Nevertheless, in other two parts percentage remained between 3 to 8percent. Effect of overgrazing was very less in NorthAmerica. However, it is almost 10times larger in Oceania.
In conclusion, in 1990, Europe and Oceania faced the higher problem of land degradation as compared to North America. The main causes behind it were deforestation and overgrazing.
[ Written by - Vikas ]
Sample Answer 6:
The presented pie chart outlines main reasons for degradation of farming land worldwide. Meanwhile, the table lists the percentages of land degradation caused in the three regions in the world in the 1990s. In general, deforestation and over-grazing are true as massive factors for agricultural land degradation worldwide.
Looking at the details, over-grazing and deforestation amass more than fifty percent land degradation, 35% and 30% respectively. In contrast, over-cultivation and other causes only confirm 35% of land degradation.
Meanwhile, regarding the region, in 1990s deforestation was the highest percentage of land degradation in Europe and accounted 9.8% of total degradation of lands. This figure was higher than over-cultivation and over-grazing in the same region. However, over-grazing was the highest percentage of land degradation factor in Oceania, 11.3% out of 13% of total land degraded for this reason. Yet, in North America, over-cultivation counted 3.3% of land degradation and was the highest cause among other factors in the same region, although it was not a high percentage compared to other causes in the other region.
[ Written by - Linda ]
Sample Answer 7:
The pie chart and table show reasons for worldwide land degradation & causes of land degradation in three different regions respectively in the 1990s. The main cause of land degradation worldwide was over-grazing which caused 35% land degradation, while the highest percentage of land degradation in different regions was due to over-grazing and in Oceania, this was the highest.
It can be examined that the second largest factor of land degradation was deforestation which differentiates by 5% less than over-grazing. Then the third driven-reason of land degradation was over-cultivation with 28% effect on land degradation. These three main reasons caused 93% total degradation of lands and remaining 7% was due to other reasons.
The area where highest land degraded occurred was in Europe which was 23%. Oceania (that included Australia and New Zealand and a large part of South Pacific) ranked as the second highest land-degraded area by only around a half of European land degradation percentage. North America is the area with the least land degradation, especially with least deforestation. Deforestation and over-cultivation contributed to European land degradation more than other parts as they were the highest level of degradation in each region.
[ Written by - Rhemawati Wijaya ]
Sample Answer 8:
The given information shows the main reasons of lands get less productive and also shows the effect of land losing its productivity in three different regions of the world during the 1990s.
As is presented in the graphs, over-grazing & deforestation are two main reasons for lands becoming less productive and these two reasons contribute to 65% of this short of less productivity of lands. Another important reason for lands are getting less productive is over cultivations which is 28% reason for this effect. All other reasons cause 7% of this decreased productivity of lands.
The reasons for which the lands degraded vary region to region and according to the table data, European lands are getting less productive by 23% in the 1990s because of deforestation, over-cultivation and over-grazing. Deforestation was the major reason why the European lands got less productive and it was 9.8% while two other reasons were around 5% to 7%. In Oceana region which comprised a large portion of South Pacific Islands, Australia and New Zealand had 13% decrease of land’s procuring capability and over-cultivation was not the reason there. Finally, North American countries were less affected (only 5%) for those man created reasons of land’s decrease in productivity.

It is clear from the table that three factors affect global land degradation, which are - deforestation, over-cultivation, and over-grazing.
According to what is shown in the table, it seems that there is a huge difference between the percentage of the total degraded land between North America and Europe by about 18%. The reason for the difference is that Europe lands are being degraded with deforestation (9.8%) significantly more than that in North America (0.2%) as well as over-cultivation and over-grazing are higher in percentages than in North America.
While in Oceania, its lands are not being degraded by over-cultivation unlike Europe with (7.7%) and North America with (3.3%) but it comes in the second place after Europe with 13% of the total degraded land. Oceania has the largest percentage of 11.3% of over-gazing among the three regions.
So we could say that Europe is the region that has the largest total degraded land that represents 23% of its land and North America contains the smallest percentage of total degraded land (just 5%).
As we can see, the pie chart shows that the primary cause that caused worldwide land degradation is over-grazing. It is responsible for 35% of agricultural land degradation. Then comes deforestation, which is responsible for 30% of land degradation. Finally, over-cultivation resulted in 28% of land degradation.
According to the table data, we can analyze the percentage of land degradation in 1990. It includes information about North America, Europe, Oceania, and South Pacific area including New Zealand and Australia. It shows that the highest percentage of land degradation, 23%, was caused in Europe in the 1990s and deforestation played a big role in it. 13% of land in the decade got degraded in Oceania and over-grazing was the main reason for this land degradation. Finally, North America witnessed 5% of land degradation in this decade and over-cultivation was the primary reason for this.
Overall, Europe seemed to be the most affected area in the world, followed by Oceania and North America, with deforestation, over-cultivation and overgrazing been the most common causes of the problem.
Looking closely at the data from the pie chart shows that overgrazing was the most common reason for the degradation of agricultural lands that contributed to 35%, which was marginally higher than deforestation and over-cultivation, 30% and 28%, respectively.
However, the table shows that effect of each of these reasons varied across different parts of the world. Europe, which had the highest percentage of total land degradation (23%), demonstrated a similar trend to the global pattern, although, significantly different from Oceania and North America. The former, which had a total land degradation of 13%, had overgrazing as the most significant cause for degradation (11.3%) followed by deforestation (1.7%), while none of the degraded lands was due to over-cultivation. Lastly, North America had the least land degradation with only 5% of its agricultural land affected, mostly due to over-cultivation (3.3%) and overgrazing (1.5%).
Overall, over-grazing accounts for the highest proportion of land degraded worldwide at present time. Also, under the impact of three actions, more land in Europe was degraded than in the two other regions during the 1990s.
In detail, over one-third of global cultivable land disappears because of over-grazing. On the other hand, deforestation and over-cultivation represent 30% and 20% causes of it, respectively. The category 'other' refers to countless other land-degrading activities, all of which make up the remaining 7 percent.
Regarding the table data, three main reasons accounted for 23 percent of degraded land in Europe in the 1990s. Among this, almost a quarter was due to over-grazing and nearly 10 percent came from acts of deforestation. On the other hand, deforestation only represented small fractions in North America and Oceania, which were 0.2 and 1.7 percent, respectively.
Another reason for the reduction of land in Oceania was over-grazing, accounting for 11.3 percent. And interestingly, over-cultivation did not do any significant harm. As for North America, over-cultivation and over-grazing represented 3.3 and 1.5 percent sequentially.
In general, over-grazing and over-cultivation are the main reasons for the agricultural land’s fertility declination worldwide.
Globally, over-grazing and over-cultivation were the two main causes of land degradation as they caused around 65% of land degeneration. Deforestation is another reason that reduced land’s fertility to 30%. All other reasons cumulatively degraded land's fertility to 7%. Out of the three continents given, Europe’s land degradation rate was 23%, North America’s 5% and Oceania’s 13%. European lands got barren due to deforestation, over-cultivation and over-grazing and this rate was higher than that of North America and Oceania. Interestingly, over-cultivation did not happen in Oceania though they had a severe problem with over-grazing. Europe seems like had been affected the most in terms of agricultural land's barrenness.
Overall, the majority of the land was degraded by overgrazing, deforestation and over-cultivation, and Europe had the largest percentage of land degradation which was affected by these factors.
As the pie chart shows, over-grazing accounted for the largest ratio of worldwide land degradation which was exactly 35%. Following this, deforestation and over-cultivation represented the second and the third reasons caused the degradation with 30% and 28%, respectively. Other factors only contributed 7% to worldwide land degradation in 1990.
Looking at the table, Europe had the highest percentage of land degradation (23%), this result came from deforestation (9.8%), over-cultivation (7.7%) and over-grazing (5.5%). Oceania stood at the second-highest level of land degradation; noticeably, 0% of Oceania degradation came from over-cultivation while over-grazing contributed 11.3% of land degradation, this was the highest contribution of three factors to the land degradation of an area in the three regions. North America was the least affected by these factors when it only accounted for 5% of land degradation by these reasons in 1990.
Report