Graph Writing # 107 - Computer ownership as a percentage of population and level of education
- Details
- Last Updated: Tuesday, 28 July 2020 12:28
- Written by IELTS Mentor
- Hits: 223620
IELTS Academic Writing Task 1/ Graph Writing - Bar/Column Graphs:
» You should spend about 20 minutes on this task.
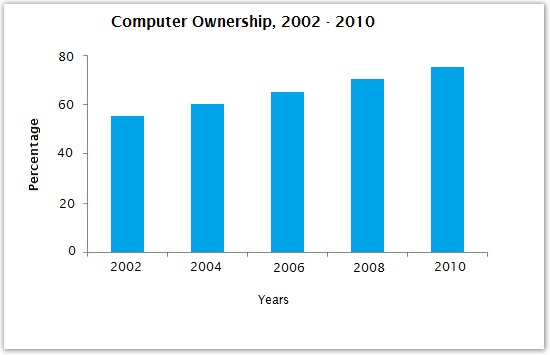
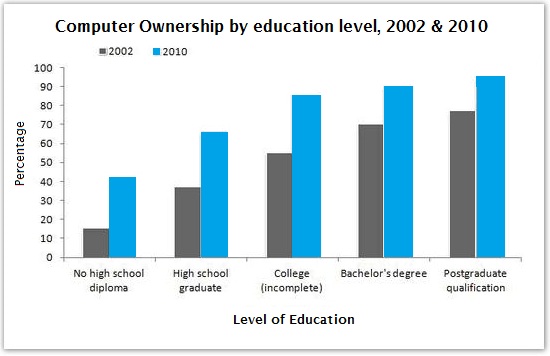
The graphs below give information about computer ownership as a percentage of the population between 2002 and 2010, and by the level of education for the years 2002 and 2010.
Summarise the information by selecting and reporting the main features, and make comparisons where relevant.
» Write at least 150 words.
Sample Answer 1:
The given bar graphs show data on the percentage of computer ownership from the year 2002 to 2010 both by comparison of total population and education level. As is observed from the given graphs, the computer ownership increased over the years and this ownership among the people with higher studies was higher than others.
According to the first graph, more than 50% people owned computers in 2002 and this percentage kept on increasing over years. After 6 years this percentage reached to over 60% and finally in 2010 the percentage of people who owned computers reached to over 70%.
From the second bar graph, we can observe that the percentage of computer ownership increased with the education level; i.e. the higher the education level the higher the percentage of computer ownership. For instance, 15% of the people who had High school graduation owned computers in 2002 and this percentage were about 60 for Bachelor degree holders and over 80 for the postgraduate degree holders. After 8 years, in 2010, the same trend could be observed and the percentage of people who owned computers increased significantly compared to 2002.
Sample Answer 2:
The bar charts illustrate the percentage of people owning a computer between 2002 and 2010 as well as the data relationship between having a computer and education level. The differences recorded are obtained from 2002 and 2010.
In 2002, more than 50% people owned a computer and it began to rise over the years. The increase was rather slow however a consistent improvement could be seen. At two years interval, the number of ownership increases by two percent. The highest amount of ownership, approximately 75% is recorded to be in 2010.
The percentage of computer ownership varied in accordance with people’s level of education. A group of people who did not receive a high school diploma possessed the lowest amount of computer. The rank followed by high school graduates, a group of people who did not finish college and bachelor's degree. Postgraduate qualifiers became the group with the highest computer ownership. Although the two lowest groups created a huge gap between one another, the change of the percentage decreased as the level of education received by a person was getting better. Not only that, the distinction between 2002 and 2010 data began to be less significant as the education level was improved.
Overall, the bar charts depict similar trends with only small changes from year to year. Apparently, the better the education one received, the greater the percentage of keeping his or her computer.
[ Written by - Taqinni ]
Sample Answer 3:
The supplied two bar graphs depict the percentage of computer belongings in a community. The first graph demonstrates the general computer ownership during an eight-year period since 2002 to 2010. Meanwhile the second graph details the figure more specifically regarding education level in both 2002 and 2010.
The overall trend created by the two sources illustrates an increasing number of people who owned computer due to the timeline and the level of education. Respectively, it can be seen that the latest the year, the higher the percentage of computer ownership and the higher the degree of education, the higher the ownership percentage.
Looking at the detail, the trend showed in the first graph gradually swelled from about 50% to around 70% out of 80% respectively from 2002 to 2010 and counted for about 20% higher from the earliest to the latest time observed.
Meanwhile, due to the education level, the ownership percentage increased gradually between 2002 and 2010 in each qualification level. As is shown by the graph, postgraduate qualification and bachelor’s degree were roughly accounted for the high number of ownership's percentage. However, the trend range of computer belongings in no high school diploma essentially was the highest increase of ownership percentage range among all qualification level. It sharply jumped to more than two times higher, about 15% and more than 40% out of 100% in 2002 and 2010 respectively. On the other hand, the smallest increase of percentage range was true for the postgraduate level that climbed up only from 80% in 2002 to about 95% in 2010.
[ Written by - Linda ]
Sample Answer 4:
The bar charts show data about computer ownership, with a further classification by level of education, from 2002 to 2010.
A steady but significant rise can be seen in the percentage of the population that owned a computer over the period. Just over half the population owned computers in 2002, whereas by 2010 three out of four people had a home computer. An analysis of the data by level of education shows that higher levels of education correspond to higher levels of computer ownership in both of those years. In 2002, only around 15% of those who did not finish high school had a computer but this figure had trebled by 2010. There were also considerable increases, of approximately 30 percentage points, for those with a high school diploma or an unfinished college education (reaching 65% and 85% respectively in 2010).
However, graduates and postgraduates proved to have the greatest level of ownership in 2010, at 90% and 95% respectively, 20 percentage points higher than in 2002. The last decade has seen a substantial growth in computer ownership in general, and across all educational levels.
[ Written by - Brq ]

A steady but significant rise can be seen in the percentage of the population who owned a computer over the period.
Just over half of the population owned computers in 2002, whereas by 2010 three out of four people had a home computer. An analysis of the data by level of education shows that higher levels of education correspond to higher levels of computer ownership in both of those years.
In 2002, only around 15% of those who did not finish high school had a computer but this figure had trebled by 2010. There were also considerable increases, of approximately 30 percentage points, for those with a high school diploma or an unfinished college education (reaching 65% and 85% respectively in 2010). However, graduates and postgraduates proved to have the greatest level of ownership in 2010, at 90% and 95% respectively, 20 percentage points higher than in 2002. The last decade has seen a substantial growth in computer ownership in general and across all educational levels.
On the whole, it is clear that the percentage of computers owners increased over the time period of 8 years. Moreover, people having better degrees were more likely to own a computer than the less educated people in both the years 2002 and 2010.
From the outset, in 2002 more than 50% of people had a computer and this percentage kept on increasing steadily over the years reaching around 60% in 2008, and eventually jumped to the highest of 75% at the end of the time period in 2010.
Looking specifically at the educational level of the individuals owning the computer in 2002 and 2010, we can see that the ratio of computer ownership increased with the education level - the higher the education, the more computers they own. In 2002, 15% of people having no high school diploma had a computer while in 2010 this percentage increased by almost 25%. Similarly, in 2002 around 35% of people having high school diplomas had a computer and this percentage increased by almost double. The same trend was followed by people in college, bachelors degree holders or postgraduates. The highest percentage of computer owners in both 2002 and 2010 were by the people having a postgraduate degree and that was around 80% and 90% respectively.
Under 60% of the entire population possessed computers back in 2002, however, the figure surged above that mark after four years. By the year 2008, roughly 70% of people had computer ownership and in 2010, it is observed that the proportion increased to every three out of four people.
In 2002, 15% of those not having finished high school-owned computers, while the percentage regarding postgraduates was around 5 times as much. 8 years later, the figures rose to sequentially around 42% and 90%. Holders of Bachelor's degree stood at 70% in 2002 and surged to 85% in 2010 in terms of having computers. As for graduated high-schoolers and those not having finished colleges, the percentage of computer ownership rose by approximately 30% after 8 years.
Generally speaking, more people owned computer devices over time and higher the education level, the higher the computer ownership percentages were.
The first bar graph depicts that computer ownership gradually but steadily increased from 2002 to 2010. In the year 2002, approximately 58% of the population had a computer in contrast to the year 2010 when over 80% of people had this device. The proportion of computer ownership has increased by 20% from 2002 to 2010.
Similarly, the second graph compares computer ownership by the education level of the owners in 2002 and 2010. As is obvious, more educated citizens had a higher proportion of computer ownership compared to people with lower education level. In 2002, only 15% of people without a high-school diploma had a computer which increased to 65% with the owners with a bachelors degree. People with postgraduate education with computer ownership was similar in 2002 and 2010 constituting the highest proportion of computer ownership i.e. 70% in 2002 and 95% in 2010 respectively.
Generally speaking, the percentage of people who owned computers increased continually over the years and higher the education level of citizens the more percentages of them owned computers.
In 2002, approximately 55% of people owned a computer and the ownership ratio enhanced by 5% after 2 years. In 2008, almost 7 out of 10 citizens possessed this device and it further rose in 2010 when eight out of ten people owned computers. It is obvious that the higher the education level of citizens were the greater percentages of them owned computers. Around 15% of people without high school diploma owned computers in 2002 and this percentage among the Bachelor degree holders were as high as 70% and more than 75% postgraduates owned this device. After a decade, the ratio further enhanced and as high as 90% postgraduates owned this technology. The computer ownership among citizens with different education level increased remarkably.
As is evident from the chart, there had been a steady rise in the possession of computers during these years.
In 2002, almost 56% of the population owned computers and the rate increased by approximately 5% every two years, and by 2010, about 75% of people had their own computers. Furthermore, significant and drastic changes were noticed in the ownership of computers according to people's education level. The lowest percentage of computers were owned by the uneducated population during both the years; i.e. 15% in 2002 and over 40% in 2010. However, the maximum computers were used by postgraduates (80% and 85% in 2002 and 2010, respectively). Possession of computers by high school, college and degree graduates were also relatively high. Overall, there was an upward trend in the usage of computers during the given years both by 'percentage of population' and by their education level.
Report