Graph Writing # 123 - GDP growth per year for three countries
- Details
- Last Updated: Monday, 17 August 2020 17:44
- Written by IELTS Mentor
- Hits: 59377
IELTS Academic Writing Task 1/ Graph Writing - Column/ Bar Graph:
» You should spend about 20 minutes on this task.
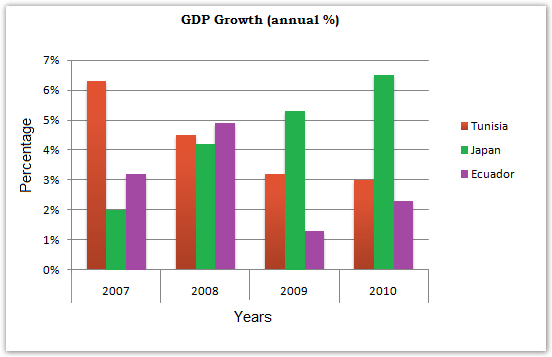
The chart below shows the GDP growth per year for three countries between 2007 and 2010.
Summarise the information by selecting and reporting the main features, and make comparisons where relevant.
» Write at least 150 words.
Model Answer:
The provided bar chart shows data on annual GDP of Tunisia, Japan and Ecuador between 2007 and 2010. As is observed from the given data, the annual GDP growth of Tunisia and Ecuador had decreased over the period while the percentage of GDP had increased remarkably in Japan.
As is given in the bar graph, initially in 2007 the annual percentage of GDP growth in Tunisia was over 6 while this was only 2% in Japan and just over 3% in Ecuador. Within three years, this GDP growth in Tunisia decreased to 3%, which is less than half of their initial percentage. In Ecuador, the GDP growth percentage also declined and fell to about 2%. On the contrary, Japan had been able to increase their annual GDP growth and the percentage increased to well over 6 in 2010 compared to only 2% in 2007.
In summary, the annual GDP growth in Tunisia and Ecuador decreased while it increased remarkably in Japan over the given period.

Overall, annual GDP in Japan increased faster than that of Ecuador and Tunisia as the year advanced. The Gross Domestic Product growth in these countries exhibited a varying trend and Japan managed to show a significant improvement while it was downgraded in case of Tunisia and Ecuador.
As is observed, initially in 2007, the annual GDP growth of Tunisia was over 6% whereas the GDP growth in Ecuador was only half of that. Japan, in this year, had the least GDP progress rate - only 2%. Interestingly, in 2008, all these three countries attained a 4-5% GDP growth, improvement for Ecuador and Japan while decreasing GDP growth in Tunisia. As the year progressed, the GDP increase in Japan got momentum whilst the other countries’ GDP decreased significantly except the 2% GDP growth in Ecuador in 2010.
Japan reached the top of the GDP growth in 4 years in 2010, with more than 6% and this was slightly over the beginning GDP growth of Ecuador in 2007.
Report