Graph Writing # 125 - International tourist arrivals in five countries
- Details
- Last Updated: Monday, 17 August 2020 17:45
- Written by IELTS Mentor
- Hits: 148158
IELTS Academic Writing Task 1/ Graph Writing - Line Graph:
» You should spend about 20 minutes on this task.
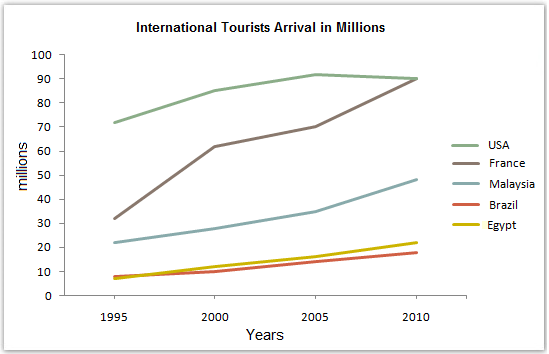
The graph below gives information about international tourist arrivals in five countries.
Summarise the information by selecting and reporting the main features, and make comparisons where relevant.
» Write at least 150 words.
Model Answer 1:
The line graph compares the number of foreign tourists arrival in five countries between 1995 and 2010.
Overall, tourist arrival in these countries increased over time, and the USA and France received the highest number of foreign travellers during this period.
As the data suggest, over 70 million international tourists landed in the USA in 1995 which was more than double than that of France. Malaysia, in this year, received around 20 million tourists while fewer than 10 million travellers visited Brazil and Egypt each. Tourists arrival in the USA gradually increased but a sharp rise could be observed in the case of France where over 80 million travellers visited in 2010. Despite the USA being the favourite among the tourists, France, as a destination, became famous with the rapid increase of its tourists' number. Moreover, approximately 50 million people went to Malaysia to spend their holidays in 2010 and this figure is more than doubled in just 15 years. Finally, tourists arrival in Egypt slowly increased and crossed the tourists' arrival in Brazil as more than 20 million people travelled to Egypt in 2010 while this number was about 3 million fewer in Brazil.
Sample Answer 2:
The given graph compares the number of international tourists in 5 different countries from 1995 to 2010.
Generally speaking, the USA had the highest number of international tourists among these countries, and the number of tourists who visited France during this period increased rapidly. So, France as a tourist destination become more popular over time.
Initially, in 1995, more than 70 million international tourists travelled the USA while just above 30 million tourists travelled to France. Brazil and Egypt had less than 10 million tourists this year compared to the just above 20 million tourists in Malaysia. Over the period, the total tourists visited these 5 countries increased with some slight fluctuations.
In 2005, tourists to the USA reached 90 million which was the highest among these countries. In this year, international tourists' number in France was about 65 million which was a sharp increase compared to its previous international tourists’ number. In Malaysia, Brazil and Egypt, tourists' number increased but did not exceed 40 million. Finally, in 2010, international tourists' number in the USA and France intersected at about 90 million. Compared to the previous years, France gained the highest ratio of international tourists. This number also increased in Malaysia and reached over 45 million which is almost double compared to the data in 1995. Brazil and Egypt had the least number of international tourists among the given five countries, and in 2010, they both had around 25 million international tourists.

The line graph illustrates the changes in the number of international tourists in five different countries from 1995 to 2010. Units are measured in millions.
Overall, all 5 countries experienced an upward trend with the USA having the highest number of international tourists and France increasing rapidly over the period given.
By 1995, almost 70 million international tourists travelled to the USA, while only 30 million travelled to France. After a decade, in 2005 the USA reached a peak at 90 million tourists. At that time, there was an enormous change in the number of tourists visiting France, which accounted for around 70 million. By the end of the period, this figure rose rapidly whereas the USA saw a slight drop. Both of these countries finished the period at the same level (just under 90 million travellers).
With regards to the other countries, there was a less significant rise in the number of tourists they received. Brazil and Egypt started the period with approximately 8 million international travellers. Furthermore, Brazil's share of tourists increased steadily and finished at just over 20 million, compared to around 15 million in Egypt. As for Malaysia, its share of travellers started at 20 million, after which it rose gradually to about 50 million.
(It took about 25 minutes to finish writing it.)
Overall, the USA and France enjoyed the highest popularity among international tourists while Brazil was the least popular. Moreover, France gained international tourists at a rapid speed over the period.
Initially, in 1995 the USA was the most popular tourist destination among the given countries and 70 million tourists went there. Brazil and Egypt each had fewer than 10 million visitors. Again, Malaysia and France were visited by 20 and 30 million people respectively.
With time, the number of international tourists arrival increased slightly in the US reaching the summit of 90 million in 2005 and decreased slightly by 2010. France started with only 30 million tourists in 1995 and it increased significantly by 2000, reaching 60 million. The popularity of these countries as tourists destinations kept on increasing. By the year 2010, visiting tourists in the USA grew thrice in 15 years. The popularity of Malaysia kept rising with slight fluctuations. At the same time, Brazil and Egypt were not much in favour of tourists and the number of arrivals changed insignificantly over 15 years from 10 million to almost 18 and 22 million respectively.
At a glance, the USA had the highest number of international tourists among these countries and France reached that level in 2000.
As is presented as a census of a perusal, Egypt and Brazil had got the least number of tourists in 1995 which was fewer than 10 million. In later years, Egypt got slightly more tourists than Brazil did. Besides, Malaysia got 20 million tourists in 1995 and it reached nearly 50 million in 2010. France was the most successful countries to attract visitors during those years and got the maximum increase in their share of international tourists. In 1995 only 30 million tourists visited France and this amount rocketed remarkably until it reached more than 80 million in 2010. Then, 70 million people chose the USA for travelling which was higher than other spheres and finally this amount was equalled to the number of tourists who selected France in 2010 as their destination.
Report