Graph Writing # 126 - Number of minutes of telephone calls in Finland
- Details
- Last Updated: Monday, 17 August 2020 17:46
- Written by IELTS Mentor
- Hits: 46791
IELTS Academic Writing Task 1/ Graph Writing - Column/ Bar Graph:
» You should spend about 20 minutes on this task.
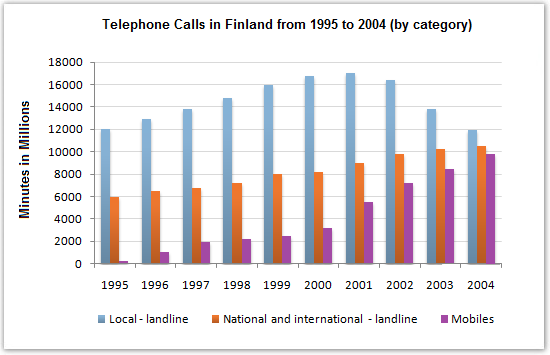
The chart below shows the total number of minutes (in millions) of telephone calls in Finland, divided into three categories, from 1995 – 2004.
Summarise the information by selecting and reporting the main features, and make comparisons where relevant.
» Write at least 150 words.
Sample Answer:
The given bar graph shows data on the three types of calls made by Finnish citizens from 1995 to 2004. As is given on the graph, most Finish citizens made local landline calls while the mobile phone usages increased over the time.
Initially, in 1995, Finnish people made 12000 million minutes of local landline calls while the national & international calling time was half of that. Very few mobile calls were made in this year. But over time the mobile calling time increased steadily and reached to about 8000 million minutes in 2003. The local calling was the most popular way of calling throughout the period but after 2001, this way of calling kept decreasing with the popularity of mobile phones and national & international calling. Mobile phone calling increased more compared to the other two ways of calling and the trends shows that over time the local landline usages declined while the other two ways of calling increased.
In summary, local landline calling in Finland is higher than mobile and national & international calling throughout the given period and total mobile phone calling time had increased more quickly than other two ways of calling.
(Approximately 194 words)

Report