Graph Writing # 37 - Number of visits to two new music sites
- Details
- Last Updated: Saturday, 18 July 2020 22:22
- Written by IELTS Mentor
- Hits: 180009
IELTS Academic Writing Task 1/ Graph Writing - Line Graph:
»You should spend about 20 minutes on this task.
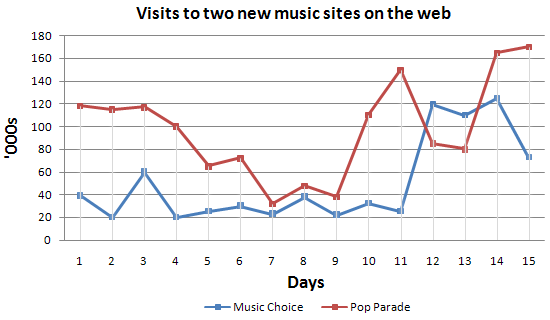
The graph below compares the number of visits to two new music sites on the web.
Write a report for a university lecturer describing the information shown below.
» You should write at least 150 words.
Sample Answer 1:
The graph exhibits the public interest of using two new music websites named Music Choice and Pop Parade in the period of 15 days’ time. According to the graph, the trends were totally unstable and have swung extremely.
The statistics of Pop Parade shows the starting point of 120000 visitors on the first day and decreased during the following 7days with the minimum number of visitors of 40000 on the 7th day. The fluctuation of Music Choice website wasn’t as extreme as the Pop Parade in the first week. The Music Choice started with 40000 visitors in the 1st day and the same number of visitors on the 7th day with small amount of changes during this week. In the 2nd week, both of the websites had the increasing interest of visitors i.e. Pop Parade reached to 140000 visitors on the 11th day and Music Choice reached to 120000 on the 12th day, and after some oscillations, the websites ended the 15 day period with 180000 and 80000 respectively.
According to the chart, the rate of 180000 was the maximum of viewers that belongs to Pop Parade and Pop Parade has More public interest for the viewers altogether than the Music Choice within these two weeks.
( Approximately 204 words )
[ by Hossein Komijani ]
Model Answer 2:
The line graph compares visitors to two music websites which were recently launched online. In general, the number of visitors to these websites fluctuated but after day 11, both sites received a higher number of visitors. Besides, more people visited pop parade music site than they did to the music choice site.
According to the diagram, pop parade music website was visited by 120 thousand people on the first day, whereas music choice got 40 thousand browsers on the same day. During the first week, pop parade’s visitor count showed an overall downward trend and on day seven both sites received roughly over 20 thousand visitors. However, overall visitors in the first week to the pop parade was significantly greater than that of music choice. Interestingly, visitors to pop parade site overwhelmingly increased after day 9 and it witnessed a great hike in the number of visitors on day 11 with around 150 thousand users. On this day, the other site was browsed by only over 20 thousand people. With a sharp dip on day 12 and 13, pop parade’s visitors went as high as 170 thousand on day 15. Music choice, on the contrary, accumulated the highest hits on day 12 and 14, which was around 120 thousand a day.
Sample Answer 3:
The line graph shows the number of users of two different music sites namely, Music choice and Pop parade within two weeks. It is clear that both music sites experienced a significant increase in terms of their number of visitors towards the end of the period. It is also noticeable that more people used Music Choice than Pop parade throughout most of the period.
Turning to details, the number of listeners visited Music choice was 120 thousand on the first day and was almost thrice than the visitors to Pop parade music website which was only 40 thousand on the same day. From first day onwards, the number of visits started to fell noticeably from 120 thousand in Music choice, except Pop Parade which had a slight decline.
By comparison, the number of people visited Music Choice was 120000, compared to Pop Parade which was used by 60000 people on the third day shown. There was a slight fluctuation in the number of visitors to Pop Parade between 20000 and 40000 from on the day 4 till 11, in comparison, has increased from 40k to 140k, the figure for Music choice in 2 days. The visitors of Pop Parade decreased steadily from 120k till nearly 118k in two days and then recovered at that rate, whereas visits of Music Choice peaked on the 14th day.
(Approximately 223 words | Written by - Boburshox)
Sample Answer 4:
The given line graph compares the number of visitors in two new music-related websites for 15 days duration. As is observed from the graph, Pop Parade music sites got more visitors than the other website except for the 12th to 13th day. On an average, the Pop Parade got more hits from visitors than Music choice website.
Initially, Pop Parade got 120 thousand visitors on day 1 while the Music choice got around 40 thousand visitors on the same day. For the first 1 week, the number of hits on Pop Parade site declined and reached to less than 40 thousand on day 7. On the other hand, Music choice’s visitor count fluctuated and reached to 20 thousand on day seven. After day 9, Pop Parade’s visitors increased dramatically and reached to over 140 thousand on day 11. While the hits on Music Choice website increased to 120 thousand on day 12. On the last three days, both of the websites got a good number of visitors. Finally, on day 15th, the Music choice website’s visitors’ number reached to around 80 thousand while that number reached to over 165 thousand for the other website.
In conclusion, the Pop Parade had been more successful than the Music choice in terms of visitor count and both sites showed fluctuation on their visitor count.
(Approximately 224 words)
( This model answer can be followed as an example of a very good answer. However, please note that this is just one example out of many possible approaches.)

The chart rudimentary elaborates that overall the Pop Parade site is mostly used by individuals rather than the Music Choice site. Without any logical fallacies, it is enunciated that there are wildest fluctuated in both sites.
There are empirical impulses to assert that the music choice site fluctuates between 20,000 and 40,000 visitors until day 11, but except on day 3. On that day, 60,000 people reached that site. Surprisingly, music choice site browses drastically jumped to 120,000 people on day 12, while the pop parade site on days 12 and 13 with a gap of around 40,000 individuals. Day 14 marked the highest point at just over 120,000 and again fell to nearly 80,000 on day 15.
It is crystal clear that the pop parade site browses 120,000 on the first day, afterwards visiting the pop parade site marginally declined until roughly 40,000 on day 7. On day 10, the number of people who visited the pop parade site rapidly rose to just above 140,000, as well as its popularity moderately decreased to 80,000 people, and then quickly moved upward as soon as the pop parade site reached its apex at approximately 160,000 on day 15.
Overall, while the graph depicts a wild fluctuation during the period, the trend is upward for both websites.
On the first day, the number of visits to Pop Parade was nearly 120,000, then a downward trend could be observed as it fell to 35,000 visits on Day 7. On day 11, Pop Parade reached a peak of 160,000 visits, and after that fell back to 95,000 on Day 12. There was a slight decline on day 13, but again visitors increased by the end of the period and reached a new peak on Day 15 for 175,000 visits.
Music Choice started with just under 40,000 hits on the first day, then visits dramatically increased to nearly 60,000 but again fell back to 20,000 with more than 60 per cent decrease. The trend showed a slight fluctuation between Day 4 and 11, then the number of visits skyrocketed to the 120,000 on Day 12. Finally, On Day 15, this music website's visits decreased sharply to 75,000.
As can be seen, visits to both sites saw numerous fluctuations, with the trend of Music Choice being more stable throughout the period. It had 40 thousand visits on the first day and the number soared to 60 thousand after 2 days. Afterwards, the figure dropped and remained between 20,000 and 40,000 daily, from day 4 to day 11. Meanwhile, Pop Parade was visited by 120 thousand music lovers initially, but then decreased dramatically by half on day 5 and became below 40,000 visits a day two days later.
The number of visits to Pop Parade increased almost 4-fold from day 9 to day 11 to reach 150 thousand. Regarding Music Choice, it had 120 thousand visits on day 12 but then dropped by more than a third after 3 days. In contrast, visits to Pop Parade doubled from day 13 to day 14, and eventually, there were 170,000 visits on the final day.
Report