Graph Writing # 47 - Japanese travelling abroad and Australia's share of Japanese tourist market
- Details
- Last Updated: Friday, 20 May 2022 13:02
- Written by IELTS Mentor
- Hits: 286414
IELTS Academic Writing Task 1/ Graph Writing - Column Graph + Line Graph:
» You should spend about 20 minutes on this task.
The charts below show the number of Japanese tourists travelling abroad between 1985 and 1995 and Australia's share of the Japanese tourist market.
Write a report for a university lecturer describing the information shown below.
» You should write at least 150 words.

Model Answer 1:
The bar chart outlines how many Japanese travelled overseas between 1985 and 1995 while the line graph delineates the percentages of these tourists who visited Australia in particular between 1985 and 1994. Overall, the number of Japanese who made overseas travels soared and this is also true for the Australia visiting travelers from Japan.
As can be seen from the illustration, around 5 million Japanese citizens travelled different countries in 1985 which kept on increasing each year except in 1991. From approximately 7 million tourists in 1987, it went as high as 12 million in just 6 years. Finally, in 1995, around 15 million Japanese toured foreign countries which was three times higher than that of a decade earlier.
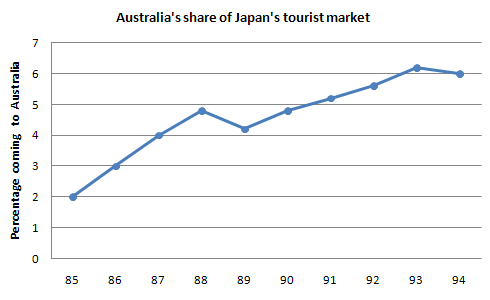
The line graph shows that 2% Japanese tourists reached Australia in 1985 and with a steady increase this figure went as high as roughly 5% in 1988. The next year the ratio slightly dipped but went higher each year in the subsequent years. Australia received more than 6% Japanese travellers in 1993, the highest, which stood at exactly 6% in 1994.
Sample Answer 2:
The supplied graphs compare the number of Japanese tourists who travelled different countries from 1985 to 1995 and it also give data on Australia's portion of the Japanese visitors.
According to the first bar graph, the number of Japanese tourists visited abroad had increased in each year except for 1991. Initially, in 1985, around 5 million tourists from Japan travelled abroad and after a decade this number more than trebled. About 2 million Japanese tourists went to Australia in 1985. From 1985 till 1988, the number of Japanese tourists in Australia increased sharply. Beginning from 2 million tourists in 1985, it reached to around 5 million in 1988. In 1989, the number fell slightly but from 90 to 94, the number went up. However, in 1994 the number of people who went to Australia decreased a bit.
The two graphs represent the steady increase of total Japanese tourists travelling different countries as well as the number of tourists visiting Australia in Particular.
( This model answer can be followed as an example of a very good answer. However, please note that this is just one example out of many possible approaches.)
Sample Answer 3:
The charts present data on the number of Japanese holidaymakers who travelled overseas over 11 years, from 1985 to 1995, and the percentage of Japanese tourist market for Australia. It is evident from the graphs that more Japanese toured overseas during this period and the number of Australia visiting travellers soared.
As the illustration suggests, from 5 million holidaymakers in 1985, the number of Japan's travellers experienced an exponential growth to somewhere in the vicinity of 11 million in 1990 before decreasing slightly in 1991. Furthermore, its rate soared again from almost 12 millions in 1992 to just over 14 millions in 1995. Moreover, from a negligible 2 percent in 1985, the percentage of Japan's tourist market rose gradually approximately 5 percent before falling back to somewhere 4.5 percent in 1990. In addition, its percentage reached a peak more than 6 percent in 1994 and fell back to 6 percent in 1995. It is evident that more Japanese travelled Australia in later years that they did in early years and the growth was steady.
Sample Answer 4:
The graphs describe the number of tourists from Japan who visited different countries and the proportion of Japanese visitors visiting Australia in one decade. As can be seen vividly, the number of tourists, both total and in percentage, visiting Australia increased significantly throughout the decade.
Starting from 1985, the number of Japanese tourists tripled from 5 millions to mostly 15 millions in 1995. However, the static increase stopped from 1990 to 1991 with a slight fall by approximately 200,000 visitors. Apart from that, the improvement of travellers travelling to Australia occurs with a small decrease from 1998 to 1990. It is also unique that in 1989 and 1991 the percentage stood at the same level, 5% of the total. Furthermore, Japanese visitors to Australia reached a peak in 1994 as much as 6.2% of total tourists.
In addition, from 1994 to 1995, the number of tourists reached a peak but the percentage of Japanese tourists travelling to Australia had a steady decrease.
( Written by - Manggala Putra )
Sample Answer 5:
Given are two charts providing a comparison of Japanese tourists travelling abroad between 1985 and 1995, as well as the certain percentages of Japanese tourist visiting Australia.
It can be inferred from the illustration that the number of Japanese tourists travelling abroad climbed steadily from 5 millions people in 1985 to approximately 11 millions in 1990. But in 1991, the Japanese travellers decrease steadily to 10.5 millions. Before soaring to a staggering 15 millions in 1995, the number of travellers remained stable between 1992 and 1994 with 13 million travellers.
It is also interesting to note that only 2 percent out of 5 million travellers in 1985 went to Australia. The percentages of the Japanese tourists in Australi went up steadily to 5 percent from 9.5 million in 1989. However, in 1990, the percentages slipped to approximately 4.2 percent. By far the highest percentages of Japanese visited Australia in 1994 with 6.2 percent from 13.5 million people, by contrast in last year, the percentages dropped steadily to 6 percent out of 15 million travellers.
( Written by - Mahfud Jiono )
Sample Answer 6:
The provided bar graph depicts the number of Japanese travellers who visited foreign countries from 1985 to 1995, whereas the line graph gives information on the market share of Australia on Japan’s tourism sector.
As is presented in the bar graph, in 1985, about 5 million people from Japan travelled abroad. Interestingly, this figure was tripled by the end of next decade (15million in 19995). During this period the trend of Japanese tourers travelling abroad increased up to the year 1990. Then, in 1991 this number was slightly reduced and after that, a gradual increase was observed until 1995.
As can be seen vividly, in 1985, Australia’s share remained 2 percent of Japanese tourists. Furthermore, a gradual increase was observed until 1988. But in 1989, this percentage reduced slightly and after that again increment in share was observed and this trend lasted till 1993 and that time Australia’s share was beyond 6 percent. Eventually, the percentage became equal to 6 in 1994.
In conclusion, Japanese tourist travelled abroad throughout the decade and in same decade Australia’s share of Japanese tourists also increased.
(Written by - Vikas Waghmare )

Overall, the number of Japanese tourists who travelled to different foreign countries increased steadily except in 1991, and the percentage of Australia's share of those travellers also increased each year except for 1989.
The bar chart demonstrates that in 1985 five million people travelled from Japan abroad, therefore, from 1985 to 1990 the number of travellers impressively increased by over ten million, and then doubled from 1985. But in 1991, it decreased just below from 1990 but, in 1992 it grew to approximately 12 million and in 1993 it reached 12 million. However, in 1994 it closed to 14 million. Finally, in 1995, Japanese visitors rose to more than 15 million, which was three times higher than in 1985.
The line graph explains the number of Japanese tourists who visited Australia in 1985. In this year it was two million but, in 1986 it increased to three million and, in 1987 it doubled from 1985. But, in 1988 it came near six million. Afterwards, it slightly reduced in 1989 and from 1990 to 1992 a substantial growth in the visitors market in Australia could be observed. In 1993, it crossed six million, that year was the highest number of Japanese travelling to Australia, which was also three times more than in 1985. Finally, in 1994 it fell to six million.
From an overall perspective, the number of Japanese tourists travelling abroad had increased over a decade during the mentioned period of time.
According to the bar graph, the figure for Japanese tourists travelling abroad in 1985 was around 4.5 million. This figure went under a gradual increase, as the time passed by and reached around 14.5 million in the year 1995, though, there was a dip in the number of tourists in 1991 from the previous year, i.e. 1990.
In 1985, the percentage of Japanese tourists among the total visitors coming to Australia was 2% which, further, soared to approximately 5% in 1988. But, next year, this rate declined by almost 1% and then kept on increasing constantly, until it reached 6% in the year 1993. However, in 1994 a slight decrease in Australia's share of Japanese tourists was noticed.
It can be observed that approximately 5 million Japanese went abroad in 1985 and mostly increased throughout the given period. After 3 years, the number of tourists surpassed 8 million and reached 11 million in 1990. Despite a decrease in the following year, the figure then rose to exactly 12 million in 1993; and between then and the year 1995, tourists increased by roughly 1.6 million each year.
Regarding Japanese tourists who travelled to Australia, the share stood at 2% in 1985 and soared to 5% in 1988. A year later, the figure dropped to just over 4% but then increased continuously to reach the highest point of over 6% by the year 1993. Finally, it dropped slightly and became exactly 6% in the following year.
Report