Graph Writing # 133 - Books read by men and women at Burnaby Public Library
- Details
- Last Updated: Monday, 17 August 2020 17:51
- Written by IELTS Mentor
- Hits: 139247
IELTS Academic Writing Task 1/ Graph Writing - Line Graph:
» You should spend about 20 minutes on this task.
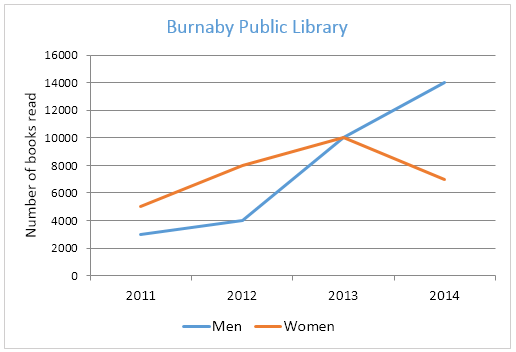
The graph below shows the number of books read by men and women at Burnaby Public Library from 2011 to 2014.
Summarise the information by selecting and reporting the main features, and make comparisons where relevant.
» You should write at least 150 words.
Model Answer 1:
The line graph illustrates changes in reading habits of male and female readers at Burnaby public library, in 3 years, starting from 2011.
Overall, women read more books than males in 2011 at Burnaby Public Library, but the number of books that men read continually increased as time went by while for women, this figure declined after having risen steadily for the first 2 years.
In details, men and women read 3,000 and 5,000 books respectively in 2011 at Burnaby Public Library. And it clearly shows that women enjoyed more books than men did. And in the following year, while the number of books men finished reading increased by one-third, it increased by 5 thousand for women, exactly twice as many books as the figure for men.
It is worth noticing that women and men read the same number of books (10,000) in the year 2013, as men's interest in books skyrocketed. Women also read more books this year than in 2012, but the change was less noticeable (exactly a quarter). Additionally, the figure for men furtherly surged to 14 thousand books in 2014, but there was a fall regarding the reading habits of women, as the number of books went down to 7 thousand.
[Written by - Nguyen Thuong Vu]
Sample Answer 2:
The line graph illustrates the number of books read by both sexes from 2011 to 2014 at Burnaby Public Library. Initially, men’s interest in reading books was slightly less than women, although it continues to rise significantly than women ultimately. In addition, books read by both male and female were the same in 2013.
Firstly, in 2011, men readers in Burnaby Public Library read fewer books than the women readers did. Men readers read around 3000 books compared to 5000 books read by women readers. Moreover, in the following year, the number book enjoyed by male readers increased slightly and reached to nearly 4000. Secondly, the book read by males rose dramatically from 2012 to 2013 and intersected the female readers' book number at around ten thousand. Finally, in 2014, books read by the male readers in this library grew rapidly to nearly 14 thousand but that of women, on the contrary, declined suddenly just around to 7 thousand.
In brief, men were less interested in reading books than women in this library at first but men have shown a change of their interest in later years.
[ by - Denise Mambrasar ]
Sample Answer 3:
The line graph presents data on the number of books read by men and women at the Burnaby public library from 2011 to 2014.
Overall, initially women readers read more books and showed more interests in reading at Burnaby Public Library but at the later period, male readers showed more interests in reading books while that was the opposite in the case of the women readers.
In the beginning, during 2011, more books were read by women readers, i.e. 5,500 than men readers, i.e. 2500 respectively in this library. In the following two years, there was a surge in the number of books enjoyed by both sexes. However, while there was a slight rise for the book read by women, that by men, on the contrary, rose at a significant pace during this period.
In 2013, the number of books read by both male and female met at an equidistant point where both men and women had read at around 10,000 books. But in 2014, we found an opposite reaction towards reading by both men and women. On one side, men reached a peak at around 14000 book reads by them, women readers, on the other side, read a significantly fewer number of books, seven thousand only.
[ by - Walia ]
Sample Answer 4:
The line graph provides information regarding how many books people read in Burnaby Public Library between 2011 and 2014.
As it is seen, men and women demonstrated different trends of reading library books. In 2011, around 3000 books were read by men, this number increased slightly by 1000 books in 2012. There was a drastic growth by 6000 books read by men over a span of 6 years reaching 10000 books. This growth continued further till 2014 when it stood at 14000 books.
On the other hand, women started with 5000 books in 2011 which rose sharply to 8000 books in 2012, and 10000 books in 2013. At this point, this number dipped dramatically to 8000 books in 2014.
It is worth noticing that, although women read more books between 2011 and 2013, their reading dropped than that of men in 2014. In contrast, men demonstrated a sharp rise in the number of reading books over a period of 3 years.
[ by - Shraddha Khanwalkar ]

Overall, men had increased their reading habit in the library over the given period while women had declined their reading habit after 2013.
According to the given information, in 2011 and 2012, women read more books at Burnaby Public Library than men did. For instance, in 2011, more than 4000 books were read by women, whereas books read by men was almost half of that. In the year 2013, the volume of reading in this library, both by men and women, intersected each other with around 10 thousand books. Interestingly, men's attitude in reading books at the library rapidly increased and reached to over 14 thousand books in 2014. On the contrary number of books read by ladies declined and the number dropped to around 8 thousand in the year 2014. In this year, books read by females had decreased substantially by 2000 compared to their number in 2013.
Report