Graph Writing # 144 - Changes in three areas of crime in New Port city
- Details
- Last Updated: Tuesday, 25 August 2020 23:45
- Written by IELTS Mentor
- Hits: 238793
IELTS Academic Writing Task 1/ Graph Writing - Line Graph:
» You should spend about 20 minutes on this task.
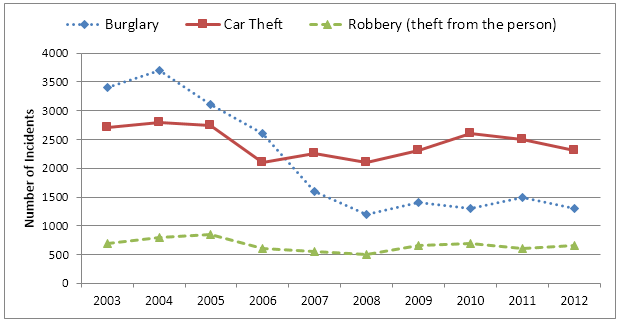
The chart below shows the changes that took place in three different areas of crime in New Port city center from 2003-2012.
Summarise the information by selecting and reporting the main features, and make comparisons where relevant.
» Write at least 150 words.
The changing rates of crime in the New Port city from 2003-2012
Sample Answer 1:
The graph represents the variation in levels in the three main areas of crime in the centre of Newport city in the time period from 2003 to 2012.
To start with, it was 3400 incidences of burglary in 2003 and 3750 in 2004. Fortunately, in the next 4 years it fell down dramatically and reached the absolute minimum in 2008 (1100 incidences), however, it then grew by 300 accidents and remained fairly constant by 2012.
Car theft was a steady level of crime from 2003 to 2004 and got reduced in next 5 years from 2700 up to 2250. The number then increased to 2700 in 2012.
Robbery reached its peak in 2005, which was 900 cases and decreased back to 500 in 2008. In the following two years, the number of incidences rose to 700 and continued to stay at this level in 2012.
In conclusion, in the Newport city centre, the rate of burglary fell significantly, the level of robbery remained fairly constant, whereas car theft raised and had the biggest number of incidences in 2012.
[ Written by - Isaeva Alena ]
Sample Answer 2:
The line graphs illustrate the variation of three types of crimes in Newport city centre over a 10-year period. In general, almost every crime rate fluctuated over the given period of time except burglary which showed an overall downward trend.
Initially, in 2003, there were more cases of burglary (approximately 3400) than car theft (roughly 2800) and robbery (just above 500). Over the time frame, there were always more incidents of car theft than robbery whereas the number of incidents of burglary was higher than that of car theft from 2003 to 2006 and there was equal in the number of cases of burglary and car theft in the middle of the year 2006. From 2007 onwards, there were more cases of car theft than burglary, which is followed by robbery.
There was a sharp dip in the number of incidents of car theft in 2006 (around 2100) before it continued to rise until the year of 2012. The number of occurrence of burglary and robbery reached their lowest points in 2008, with figures just above 1000 and 500 respectively.
[ Written by - Lee Wing Qeen ]

Thanks in advance for the reply.
Report