Graph Writing # 148 - British people giving money to charity by age range
- Details
- Last Updated: Tuesday, 25 August 2020 23:46
- Written by IELTS Mentor
- Hits: 203678
IELTS Academic Writing Task 1/ Graph Writing - Column Graph:
» You should spend about 20 minutes on this task.
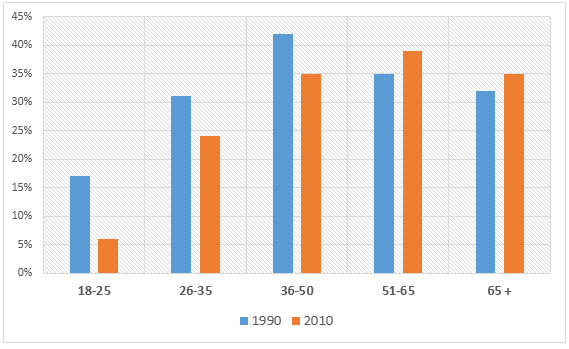
The chart below gives information on the percentage of British people giving money to charity by age range for the years 1990 and 2010.
Summarise the information by selecting and reporting the main features, and make comparisons where relevant.
» Write at least 150 words.
Model Answer 1:
The chart examines the levels of donation contributions by British people of different ages in two different years - 1990 and 2010.
Overall, a greater percentage of British people gave money to charity in 1990 than in 2010 except for the people who were over 50 years old. It is worth noticing that, elder people donated more for charity than their younger counterparts.
In 1990, 42% of the 36-50 age-group in Britain made charitable donations, and this figure is the highest on the chart. The 18-25s contributed the least at only 17%. By 2010, these figures had fallen significantly to 35% and 7% respectively. The level of donations from the 26-35 age-group also experienced a decrease in 2010 from 31% to 24%.
While donations up to the age of 50 declined across the two years, they rose among the 51-65 age-group from 35% to nearly 40%, which was the highest percentage for 2010. The figure for the over 65s was lower than this, at 35% but it was still a little higher than the 1990's figure of 32%.
Sample Answer 2:
The bar graph illustrates the ratio of British citizens' contributions to charity based on their age in two different years - 1990 and 2010.
Overall, more British gave money to charity in 1990 than they did in 2010. However, people over 50 years old did just the opposite and a fewer younger Britsh donated to charity than the adults did both in these years.
In 1990, 42% British between the age of 36 and 50 donated to charity and this ratio was the highest. In contrast, only around 17% youth from the 18-25 age-group contributed to the philanthropy works which was the lowest. After two decades, both these percentages declined significantly, 35% and 7% respectively.
While donation participation by the people up to 50 years old decreased in 2010, it sored among the people over 50 years old. In 2010, welfare donation by 51-56 age-group was 38%, a raise than 1990 and it was 35% by the 65+ age group, also an increase.
Sample Answer 3:
The bar graph illustrates how many British citizens devoting money to charity by various age groups in the years 1990 and 2010. Overall, it is clear that majority of people donating money aged 36 to 65 for both years and people aged from 18 to 25 were the least to donate money.
First and foremost, the most striking feature is that there was an increasing trend in the proportion of British people donating money in 1990 and peaked at people aged 36 to 50 (just above 40%) which is then followed by a gradual drop. The proportion of people who aged over 65 giving money to charity accounted for about 33%.
Turning to 2010, it is revealed that there was a significant rise in the percentage of British people who donate money (approximately 6% for those aged 18 to 25 and 24% for that age group of 26 to 35). A similar trend can be observed for the next age group and hit its peak at about 40%for those aged 51 to 65. In contrary, an opposing trend can be seen in the last age group (people aged over 65).
[ Written by - Lee Wing Qeen ]

At first glance, people in the 18–25 age group gave funding to charity, which was comparatively less than the 36–50 age group.
At the beginning, the age group of 18–25 young people providing money for charity was around 12% and 8% in both years. However, mature age group had donated money approximately 42% and 35%. Likewise, the age group of 51–65 people also provided the same rate of money to the charity, but this group's donation rate had increased as compared to the mature age group because in 2010, their donation rate dropped by around 7%.
On the othere hand, old age group people showed increased rate to give money for chairty in 2010 - accounting for 35%. However, in 1990, the age group of 26 to 35 and those above 65 had the same ratio of donation, but the age group of 26 to 35 showed a decline rate of around 25%.
In general, as it can be inferred, in 1990, the British in the 36-50 age group were more charitable. However, in 2010, people in the UK from the age group of 51-65 years were more charitable.
As it can be seen from the chart, in 1990, 18% of the youth, in the age group of 18-25, were more charitable. However, that decreased sharply in 2010 to approximately 6%. Nevertheless, in 1990, seniors provided less money to charity, and that percentage was 32%; which was followed by a slight increase in 2010 to 35%. Back to young adults, in the age group of 26-35, there was a sharp shrink from 31% in 1990 to less than 25% in 2010. The percentage of people in 36-50 age who donated to charity had dropped dramatically from around 42% in 1990 to 35% in 2010. A rapid rise happened in the proportion of 51-65 people from 35% in 1990 to about 40% in 2010.
Report