Graph Writing # 160 - Average levels of rainfall in Marley in the UK
- Details
- Last Updated: Tuesday, 25 August 2020 23:57
- Written by IELTS Mentor
- Hits: 27514
IELTS Academic Writing Task 1/ Graph Writing - Bar Graph:
» You should spend about 20 minutes on this task.
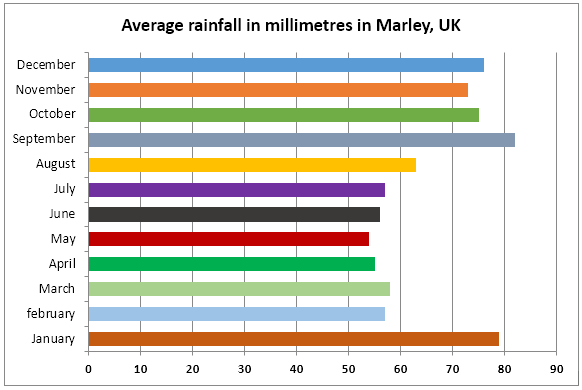
The chart shows average levels of rainfall in Marley in the UK.
Summarise the information by selecting and reporting the main features and make comparisons where relevant.
» Write at least 150 words.
Sample Answer:
The bar graph describes the usual amount of rain precipitate over a year in Marley, UK. It can be clearly seen that December, September and January have the highest amount of rainfall noted in a year.
Primarily, from December to September, the amount of rainfall increases from about 84mm to approximately 94mm. the rainfall in October has an identical amount in December by about 84mm. interestingly, the level of rainfall dramatically declines from September to May, which levels off at about 51mm.
However, this trend does not last when the rain precipitate minimally rises in April (58mm) and is followed by a moderate soar in March by approximately 64mm. In February, the figure decreases but it is followed by a tremendous increase in January that reaches by roughly 79mm.
Overall, there is a drop in rainfall in the middle of the year, yet it increases dramatically in the succeeding months.
[ Written by - Chino ]

Report