Graph Writing # 163 - Population of turtles in India from 1980 to 2012
- Details
- Last Updated: Tuesday, 25 August 2020 23:57
- Written by IELTS Mentor
- Hits: 100386
IELTS Academic Writing Task 1/ Graph Writing - Line Graph:
» You should spend about 20 minutes on this task.
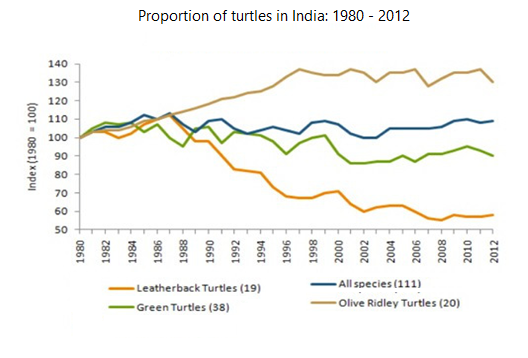
The graph below gives information on the population of turtles in India from 1980 to 2012.
Summarise the information by selecting and reporting the main features and make comparisons where relevant.
» Write at least 150 words.
Model Answer 1:
The line graph gives data on different turtle species in India between 1980 and 2012. The given turtle population index clearly states that leatherback turtles greatly reduced during the given period while the Olive Ridley species managed to increase their population in India.
Analysing the illustration reveal that there were 111 turtle species in India and the 1980 turtle population index considered 100 units and in this year, all turtles in India were at unit 100. However, over the time, leatherback turtle’s number dropped significantly and reached to only 60 units while an opposite trend could be observed in the case of Olive Ridley turtles. This species continually expanded, according to the index, till 1997 and then showed some fluctuations with a sharp drop in 2012 when it was just over 120 units. Finally, the green turtle’s index indicates that a rapid oscillation was visible in the population of this turtle. Over the years, this species's population, however, slightly dropped and they were just over 90 units in 2012. The index of all turtle species did not change significantly, though there were many ups and downs in this number. The important information that the diagram provides is the number of various types of turtle species. It was 19 for leatherback turtles, 38 for green turtles and 20 for Olive Ridley.
[Written by - Tony]
Sample Answer 2:
The given line graph illustrates the number of population of four various kinds of turtles in India between 1980 and 2012. The unit is measured in Index. It can be clearly seen from the graph that the number of Olive Ridley turtles soared within the given period of time and the figure of Leatherback Turtles gradually plummeted across the given period.
To begin with, in the year 1980 the number different turtle population represented the same figure (100). After that, the number of Leatherback progressively rose up and reached to above 130 in the year 1997. Thereafter it showed fluctuations and presented the figure of the population to 130 during the year 2012.
Similarly, all species showed gradual increase till 1987 (110) and following that depicted oscillation and hit figure almost 110. Green Turtles showed a downward trend. The number of Green turtles palpitated throughout the given period and the population figure reached almost 95 in the year 1989.The number of Olive Ridley Turtles presented sharp increase till 1987(110) and thereafter showed sharp decline throughout the given years and reached its number to below 60 in the year 2012, which is the least number of the population showed among turtles.
[Written by - Rija]

Overall, the figures fluctuated for all the kinds of turtles in the study, over a 33-year period of research. It is also clear that the Olive Ridley Turtles multiplied in 1997, while the Leatherback turtles declined in 2012.
In detail, there was a steady increase in the population size of Green Turtles from 1980 to 1984 before it oscillated from 1988 until 2002. It remained at 90 in the last study year. By comparison, all species climbed in population between 1980 and 1987 and fluctuated from 1990 until 2004. It levelled off at 105 before slightly increasing to 110 in 2012.
the population of the Olive Ridley Turtles was progressive for the first 11 years. The figure rose in 1997 before an irregularity was noted from 2002 to 2012. In contrast to the Leatherback turtles, the number improved by 10 in 1987 but subsequently dropped at a constant rate in 2012 to almost half of the peak record of Olive Ridley Turtles in 1997.
In 1980, all the varieties of turtles were at 100 and were in an equal ratio. However, the Leatherback turtle increased in its population remarkably and reached its peak at 140 species in 1997. Thereafter, it remained more or less the same with minor fluctuations. On the contrary, the Olive Ridley Turtles population saw a rise in the first 7 years. Moreover, it also reached its peak with 110 turtles, but, the population decreased dangerously, as it touched its lowest point at around 65 in the year 2008.
While the Green turtle species count fell steadily, as it started at 100, and reached its peak at 108; there were many fluctuations in the population from 1996 to 2001. However, then it remained below 100. All in all, the species have noted many fluctuations, but still, it maintained between 100 and 110.
Generally speaking, Olive Ridley Turtles became the dominating turtle species in terms of their number in India. Nevertheless, the number of Leatherback Turtles kept on decreasing, and they faced the risk of extinction in India.
According to the graph, the populations of Leatherback Turtles, Green Turtles and Olive Ridley Turtles had a similar population from 1980 to 1988. After that, the turtle population changed. The number of Leatherback Turtles decreased from around 100 indexes in 1988 to only 60 indexes in 2012, while Green Turtles was declined from 90 indexes in 1988 to 80 indexes in 2012. They both had a lower population than other species in 2012. However, Olive Ridley Turtles species count upsurged from 1988 to 2012, and it had exceeded the count of all other turtle species in 2012.
Report