Graph Writing # 164 - Household recycling rates in three different countries
- Details
- Last Updated: Tuesday, 25 August 2020 23:57
- Written by IELTS Mentor
- Hits: 102449
IELTS Academic Writing Task 1/ Graph Writing - Line Graph:
» You should spend about 20 minutes on this task.
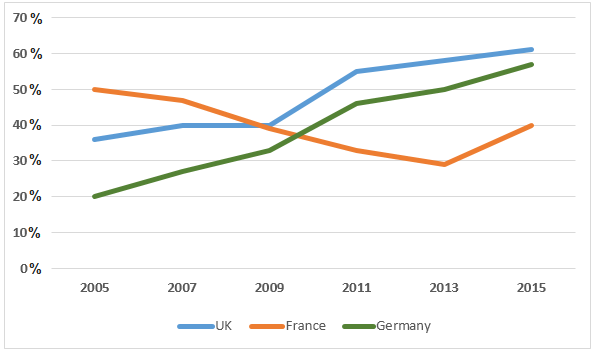
The line graph below shows the household recycling rates in three different countries between 2005 and 2015.
Summarise the information by selecting and reporting the main features and make comparisons where relevant.
» Write at least 150 words.
Regional household recycling rates
Sample Answer:
The given line graph compares the proportion of domestic waste recycling in the UK, France and Germany from 2005 to 2015. Overall, the recycling rates in the UK and Germany increased over the period while it actually decreased in France.
According to the given illustration, the household recycling rate in France was 50% in 2005 which was approximately 13% and 30% higher than that of the UK and Germany respectively. After four years, recycling quotient in these three countries stood at around 40% and the pace actually increases during this period both in Germany and the UK while it dropped in France. The recycling rate in France kept on falling and in 2013 it recycled around 30% household garbage. In the meantime, the recycling rate in Germany and the UK continually improved and both countries recycled over 50% wastages in 2013. In the final year, the household recycling rate in France went high than that of 2013 and stood at 40%. In this year household recycling ratio in the UK was highest, over 60% and in Germany, it was around 58%.

Overall, the line graphs show three different countries from which two countries - that is The United Kingdom and Germany household recycling rates rose from 2005 to 2015, and France's regional household recycling rate first declined and afterwards, increased.
In 2005, the UK stood at 35% recycling rate. France stood at 50% whereas Germany was 20% in this recycling rate. Furthermore, both the country UK and Germany increased their household recycling rate from 2005 to 2015, but from 2007 to 2009, the UK showed a fixed percentage - which was 40%. This rate, in France, on the contrary, decreased compared to their earlier rate in 2005.
France, in 2005, had the highest percentage of recycling among these three countries with about a 50% recycling rate. But it dramatically fell from 50% to 30% in 2013. And then France's percentage of recycling increased a bit to 40% at the end of the period. Therefore, France had a lower regional household rate than the other two countries at the end of 2015.
Overall, at first glance, household recycling in the UK and Germany increased, but it declined in France.
To begin with the line chart, household waste recycling was 20% in Germany, just over 35% in France and 50% in the UK. Moreover, the trend of that recycling rates in France was ticking down and reached the lowest point of 30% in the year 2013, before reaching 40% in 2015.
On the other hand, the trend of recycling rate overall increased in the UK and Germany and they showed a similar pattern. In 2005 it was 20% in Germany and it kept increasing steadily throughout the time before picking at almost 60% in 2015. Similarly, it was over 35% in the UK and it reached just over 60% in 2015.
Overall, the recycling rates of the UK and Germany increased gradually while the opposite trend was true in France. More specific information will be summarized below.
To begin with, in 2005, precisely half of all domestic waste in France was recycled. The figure of the UK (also in the year 2005) was almost 40 per cent, which was nearly double from recycling in Germany.
After four years, France's recycling rate decreased to four out of ten households, intersecting the UK. Then in 2011, the proportion of recycling in France furtherly dipped below 35%. Conversely, figures for Germany and the UK grew to approximately 45% and 55%, respectively, to surpass that of France.
Germany and the UK continued to have stable increases in their proportions of household recycling rates. Their figures hit the highest point by the end of 2015. Around 60 per cent of waste was recycled in both countries in the year 2015. Regarding France, the rate was down to 30% in 2013 before increasing by one-third 2 years later.
Report