Graph Writing # 178 - Water used for different purposes in six areas
- Details
- Last Updated: Friday, 12 August 2022 13:53
- Written by IELTS Mentor
- Hits: 492647
IELTS Academic Writing Task 1/ Graph Writing - Pie Charts:
» You should spend about 20 minutes on this task.
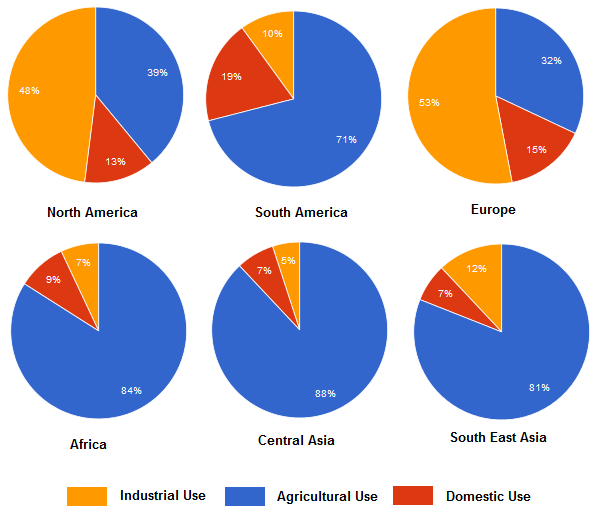
The charts below show the percentage of water used for different purposes in six areas of the world.
Summarise the information by selecting and reporting the main features, and make comparisons where relevant.
» Write at least 150 words.
Percentage of water used for different purposes in six areas of the world.
Model Answer 1:
The provided pie charts compare the domestic, agricultural and industrial water consumptions in six major parts of the world. In general, the highest percentage of water is utilised for agricultural purposes in Asian, African and South American countries while about half of the water in Europe and North America goes to industrial sectors.
As can be seen from the given pie charts, North America's water consumption has a striking similarity to that of Europe. In both of these continents, about half of the water is required in industrial sectors, almost one-third for crop cultivation and 13-15% for people’s household use. Interestingly, South American’s water-absorbing habit is quite contrary to the North American region and it is more like the water consumptions in Asian and African continents. A great portion of water goes to agricultural division in Asian, African and North American countries which is over eight-tenths of their total consumption. The highest water consumption is cultivation could be observed in Central Asia (88%) which is almost treble than that of Europe. Household water use in South America is higher than other parts of the world and that stands at 19%. Only 7 to 9 percent water is used by people in Asian and African countries for their personal use at home. Finally, the industrial water consumptions in Asian and African areas ranges from 5% to 12% and this ration is quite lower than that of Europe and North America. Interestingly, South East Asia uses more water for manufacturing than each of Africa, central Asia and South America.
[Written by - Sandra Jordan]
Sample Answer 2:
The provided illustration compares water consumption for three main purposes in six different areas namely: North America, South America, Europe, Africa, Central Asia and South East Asia. Overall, it is clear from the charts that Asian and African countries used more water for irrigation while North American and European countries used more water for their industrial needs.
To begin with, a major portion of water consumption could be observed in the agricultural sector and this was higher in African and Asian regions than that of American and European parts. More than 80% of water in Africa and Asia went into agricultural fields while this percentage was only 32% in Europe and 39% in North America. North America and Europe required more water in their industrial sectors than that of Asian and African countries. While half of the water was used in the industrial sector in North America and Europe, the percentage of that in African and Asian regions ranged from 5% to 12%. Interestingly, water consumption in North and South America shows a contrasting scenario. Finally, more percentages of household water consumption could be observed in American and European continents than that of Asian and African regions.
[Written by - Piero]
Sample Answer 3:
The provided figures give information on the percentage of industrial, agricultural and domestic use of water in the six different regions of the world. Generally, as can be seen from the illustration, the highest percentage of water is used for agricultural demands, while the least percentage of water is used for the domestic needs.
In Africa, South America, Central and South-East Asia more than 70 percent of water goes to the agricultural sector, whereas in North America and Europe this index is 39 % and 32% respectively. On the contrary, these regions consume more water for industrial purposes (48% and 53%), while industrial purposes require only about 10 % average in South America, Africa, Central and South-East Asia. The biggest percent of domestic water use could be observed is in South America (19%) and Asian regions use the minimum water for domestic needs. The maximum usage of water for agricultural aims is in Central Asia (89 %), and only 32% of water is used by the European farming sector.
[Written by - Erlan]

In detail, north America and Europe show similar water use distribution patterns, with around half of the water used for industry, one-third for agriculture, and the rest of the water used for households. South America's consumption resembles Asia and Africa more, with a significant portion of their water going to their agricultural industry. Central Asia, on the other hand, stands out with the highest agricultural water use.
Moreover, household water use is highest in South America and lowest in Asia and Africa. Industrial water consumption is relatively low in Asia and Africa compared to Europe and North America, but Southeast Asia has higher industrial usage compared to other regions.
Overall, continents like Central Asia, Europe and South America use the maximum amount of water for Agricultural, Industrial, and Domestic purposes respectively. Whereas places like Central Asia, and Europe use the minimum amount of water resources for industrial and domestic purposes.
It is noticeable that in Central Asia, Africa, South America and South East Asia, more than seventy to eighty percent of water is used for Agriculture whereas lower than 40% is used in North America and Europe. Likewise, almost half of the water is used for industries in both North America and Europe whereas less than a fifth of water is consumed by South America, Africa, Central Asia, and South East Asia. Additionally, in Europe, North America and South America more than a fifth of water is used for Domestic and less than 10% of water is used in Africa, Central Asia, and South East Asia for the same purpose.
As an overall trend, the main water consumption in North America and Europe was for industrial usage while it was primarily agricultural use in South America, Asia and Africa.
As the data suggests, half of the toal water consumptions in Europe and North America was for industrial use. In these tw oregions, agricultural water useages comprisded alsmost one-third of total while the rest was for doemstic use. Contrary to this, Asia, Africa and South America nedded most of the water for argicultural use. Irrigations and cultuvation in these regions required 70 to 88 percent of water. Moreover, their industrial water consumption was almost ignorable - somewhat 5 to 10 percent. It is worth noticing that, household water use in these areas was also less in percentages when it is compared to Europe and North American use.
Generally speaking, most water usages accounted for the agricultural purpose in central Asia, whereas industrial and domestic respectively in Europe and South America. On the contrary, Europe, Central Asia and South East Asia used comparatively less water for respectively agriculture, industries and domestic purposes.
More specifically, the total percentage of water used for domestic and industrial purpose in Central Asia is equal to industrial consumption in South East Asia- roughly around 12%. The total share of agricultural and domestic uses in Europe is Equal to industrial consumption in North America- which was around 48%.
The Asian region used the highest proportion of its water for agricultural purpose (above 80%) and least for industrial and domestic users (5% to 12%). South America and the African region also following the same trend. However, North American and European countries used most of their water supplies for industrial use (almost 50%).
Overall, the western world uses more water for industries while eastern parts use more water for agriculture.
As can be seen, water used for industrial purpose in western parts of the world is higher than that of in eastern parts. This is particularly true in Europe in which 53% of water usage is for industries. This is also true in North American where nearly 50% of the water is used by industries. The lowest water consumption for industrial purpose is by Central Asia with only 5%.
In contrast, a significantly large proportion of agricultural use of water in seen eastern regions. In Africa, Central Asia and South East Asia, the water consumption by agriculture is over 80% - the highest in the world. However, the areas, North America and Europe, with the high consumption rate in industries, have the lowest rates for the agricultural use which is 39% and 32%, respectively.
In South America, where the water usage for industrial use and agricultural use are medium, domestic water usage is the highest with 19 per cent.
As can be seen, Central Asia uses almost 90% of water for agriculture purpose and similarly, the figures in South East Asia and Africa for the same purpose also exceed 80%. These regions allocate only from 5 to 12 per cent water to the remaining purposes. In South America, farming fields also account for the largest water consumption, which is 71%, however, industrial use stands at exactly one-tenth while domestic activities represent nearly twice as much.
North America and Europe, on the other hand, use 48% and 63% of their water for industries, respectively. At the same time, these regions use 13-15% water for household activities, which is larger than in Africa and Asia but smaller than in South America. It is also worth noticing that North Americans distribute just below 40% water to agriculture, an amount exactly treble that the domestic use.
Overall, in Asian, African and South American countries, the highest percentage of their total water utilization was for agriculture purposes - from 71% to 88%. Nevertheless, North America and Europe consumed most of their water for industrial uses - it was about half of their total consumption.
The pie charts clearly show that three regions such as North, South America and Europe used water for household necessities (13-19%), whilst domestic uses of water in South East, Central Asia and Africa was 7-9%. However, the two zones that are located in North America and Europe utilized numerous water for their industrial sector, they applied 32-39 per cent of total water for their agricultural function. Whereas, water used for manufacturing in South America, Africa, Central and South-East Asia was 10%, 7%, 5%, 12% respectively.
South American, African, Central Asian and south-east Asian people have devoted the highest percentage of water to agriculture and their irrigation needs while around half per cent of consumption goes for the industrial programmes in Europe and North America.
Interestingly, a similar water consumption pattern in North America and Europe could be observed. They utilized 48% and 53% of water for industrial needs, 39% and 32% for agriculture portions in North America and Europe sequentially. As we can see, the European population consume only 2% more than North Americans for domestic uses.
By comparison to the other four, we see the lowest water consumption in the industrial sector is in the Central Asian region, while the African continent is in second place with a 2% difference. Definitely, South Americans consumed the highest proportion of water for household needs. Also, people in Central and Southeast Asia have the same tendency for domestic water consumption, while people in Southeast Asia consume 7% more water in their industrial sector.
To be more specific, in four out of six regions, water is perceptibly used for fertilization of crops, where central Asia used 88% of water, and usage in South East accounted for 81%, the second-highest proportion of water used for irrigation. Moreover, South America and Africa utilized 71% and 84% water respectively.
Noticeably, in Europe, half of the water is consumed in the industrial sector while agricultural water use is 32%. This is particularly true for North America as well where 48% of water consumption accounted for industrial usage while 39% for farming. In addition, in Central Asia, utilization of water for industrial usage is markedly lower, approximately 5%; whilst, Africa, South East Asia, and South America accounted 7%, 12% and 10% respectively. In terms of household usage of water, each mentioned area shares less than 20% of water utilization. While Central Asia and East Asia had a lower per cent of water usage for the domestic purpose.
The pie charts illustrate the proportion of water usage for a variety of purposes in six main continents of the world. Overall, North America and Europe used the major percentages of water for industries while the remaining continents used the major proportion of water for irrigation. In most areas, household water accounted for the least percentage of use ranging from 7% to 15%. Domestic water use, in terms of total water consumption, was highest in South America (19%) and lowest in Asia (7%). In addition, African and Asian continents consumed more than 80% of their water for irrigation and only 5%-12% for industrial use. On the contrary, nearly half of the water consumption in North America and Europe went on industrial use and around one-third for agricultural use. Notably, the pattern of water use in South America was quite different from that in North America as the former used 71% of water for irrigation and only one-tenth for industries compared to 39% agricultural and 48% industrial use in the latter continent.
Overall, North America and Europe used more percentages of water for their industrial use while the remaining continents used the largest portion of their water for agricultural use. Household water use accounted for the least percentage of use varying from 7% to 19% in these continents. Domestic water use, in terms of total water consumption, was highest in South America (19%) and lowest in Asia and Africa. However, the African and Asian continents consumed over 80% of their water for irrigation and only 5%-12% for industrial use.
On the contrary, almost half of the water consumption in Europe and North America went on industrial use and around one-third for horticultural use. South America’s water use was quite different than that of North America as the former used 71% of its water for agriculture and only one-tenth for their industries compared to 48% industrial and 39% irrigation use in the latter continent.
The pie charts show the comparison of water consumptions for industrial, agriculture and domestic use in six different regions. Overall, the agricultural sector accounts for the largest proportion of water consumption in most areas, except for North America and Europe. By contrast, North American and European people spend water mostly for industrial use.
Water usage for agricultural purpose in South America was 88%. Similarly, Africa, South America, South East Asia have a clear majority of agriculture water use- 84%, 71% and 81% respectively. In contrast to these four countries, this figure secures a smaller amount in North America and Europe, at approximate one-third each. Although they use a small amount of water in agriculture, people in North America and Europe spend a good proportion (around 50%) in industrial purpose. It is noticeable that domestic use only accounts for a small percentage in all areas. This figure makes up above 10% in North America, South America, Europe whereas it is under 10% in other areas.
According to the given information, in all regions except Europe and North America, agricultural water use was the most common with over 80% of usage in Africa, Central and South-East Asia followed by 71% in South America. On the contrary, the highest percentage of water goes to Industry in North America and Europe and the proportions of domestic use were there 13% and 15%, respectively. Usage of water for the Industrial purpose and Domestic use was lowest in Africa, Central & South East Asia and South America. Only 7% of water was used for Domestic usage in Asia and 9% in Africa. However, this usage was slightly higher in South America, which accounted for 19%. Turning to Industrial water usage, the proportion of consumption in South East Asia was 12%, followed by 10% in South America.
Report