Graph Writing # 189 - Unemployment rates for the USA and Japan from 2005 to 2011
- Details
- Last Updated: Wednesday, 26 August 2020 00:01
- Written by IELTS Mentor
- Hits: 18692
IELTS Academic Writing Task 1/ Graph Writing - Line Graph:
» You are advised to spend about 20 minutes on this task.
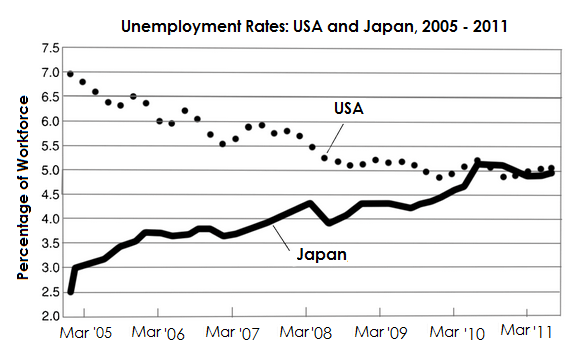
The line graph below shows the unemployment rates for the USA and Japan between March 2005 and March 2011.
Summarise the information by selecting and reporting the main features and make comparisons where relevant.
» You should write at least 150 words.
Sample Answer 1:
The line graph compares the percentages of unemployed Japanese and Americans from 2005 to 2011. Overall, the unemployment rate in the USA was considerably higher than that of Japan in 2005 but after five years the rate became the almost the same in both countries.
Now, turning to the details, exactly seven percent workforce in the USA was unemployed in 2005 which was almost thrice than the unemployment Japanese workforce. In March 2006, joblessness among the US citizens dropped by one percent while it increased to over 3.5 percent in Japan. Following that, the unemployment rate in the USA kept on decreasing with some fluctuations and reached to 5.5% in 2010 whereas an exactly opposite was the truth in the case of the Japan, where the percentage of jobless people steadily climbed until it reached to 5.5% in 2010. Interestingly, unemployment rates in the USA and Japan intersected each other by 2010 and with few minor rise and fall, both remained almost the same until the end of 2011, despite a huge gap, 4.5% to be more precise, in early 2005.

Now turning to the details, the Japanese amount of citizens without a job was about 2.5 per cent of the total workforce in 2005. Over this period, this percentage gradually increased until it reached 5.0 per cent in 2011. There was a peak in 2010 of around 5.2 per cent. On the contrary, in the United States, this unemployment rate decreased from 7.0 per cent to about 5.1 per cent over the entire period. However, it was not a linear fall; there were some small fluctuations on it. But it is clear that the unemployment rate in Japan increased despite their initial better condition, but the United States of America managed to reduce their unemployment rate during the given period.
Report