IELTS graph writing # 210 - Riverdale School spending per student
- Details
- Last Updated: Wednesday, 26 August 2020 00:09
- Written by IELTS Mentor
- Hits: 21853
IELTS Academic Writing Task 1/ Graph Writing - Bar Graph:
» You should spend about 20 minutes on this task.
The bar graphs below show the Riverdale Public School’s spending per student in a year as well as percentages of students who passed the reading and math tests from 1990 to 2005.
Summarise the information by selecting and reporting the main features, and make comparisons where relevant.
» You should write at least 150 words.
Riverdale public School System

Riverdale public School - Reading and Math Test
Sample Answer 1:
The first bar graph shows yearly spending for each pupil in Riverdale public school from 1990 to 2010 while the second graph shows the percentages of students from the same school who passed in reading and math tests during the same period of time. As can be seen, yearly spending for each pupil in Riverdale School decreased over the time and the percentage of pupils who passed the tests has also dropped.
According to the illustration, Riverdale school spent 12 thousand dollars for each student in 1990 and that was higher than the spending on per student in any other given year. The spending fell to around ten thousand dollars in the next year and it further dropped to nearly 9 thousand in 2000. After five years the amount spent decreased to precisely 8 thousand and finally in 2010, the school authority’s cost for each student was roughly 7 thousand dollar.
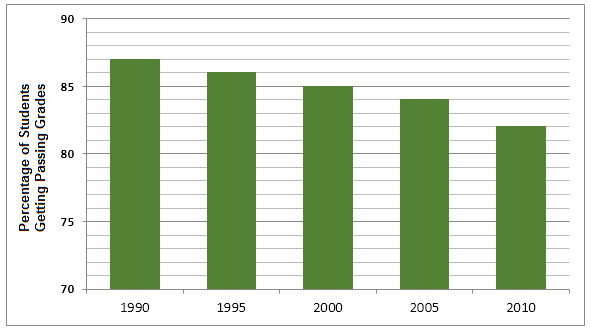
The second bar graph shows that the percentages of students in Riverdale school who passed the reading and math test kept on declining over the time. In 1990, approximately 87% pupils passed these tests while in 2000 this percentage dropped to 85%. Finally, 82% secured their pass score in these tests in 2010 which was a 5% drop from the initial percentage of students who got the pass marks.

Overall, both the amount of money and the percentage of students passing exams declined stably over the period. More specific information will be summarized in the following paragraphs.
To begin with, 12 thousand dollars per student was what Riverdale Public School spent to cover its pupils' expenses, in the year 1990. The figure decreased to 10 thousand for each pupil five years later and then dropped consistently until 2010. After 1995, a 1000-dollar decline can be seen after every 5 years, and in 2010, the school spent exactly 7,000 dollars for every learner.
Regarding the second bar graph, 87 percent of students in Riverdale public school managed to pass the reading and math tests in the year 1990. The figure decreased steadily by 1 percent every five years until 2005, and in this year it was 84%. And finally, the percentage of exam-passing students was 82% in 2010, according to the illustration.
Report