IELTS graph writing # 211 - Journey by different means in 4 countries
- Details
- Last Updated: Wednesday, 26 August 2020 00:09
- Written by IELTS Mentor
- Hits: 42866
IELTS Academic Writing Task 1/ Graph Writing - Table + Bar Graph:
» You should spend about 20 minutes on this task.
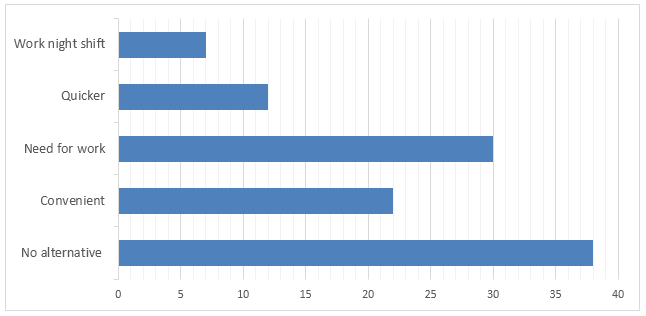
The table below shows the percentage of journey by different means in 4 countries and the bar graph shows the reasons for Canadian people to use a car to reach their workplace.
Summarise the information by selecting and reporting the main features, and make comparisons where relevant.
» You should write at least 150 words.

Sample Answer 1:
The table data presents information on modes of transportations used by the citizens in four countries while the bar chart shows the reasons for using cars by Canadians to reach their offices. Overall, the car is the most preferred transportation and most of the people in Canada travel by cars because they think they do not have a better alternative or their need for work.
According to the table, nine out of ten journeys in Canada are made by private cars and Canadian people use cars for commuting more than the people in other countries do. The bicycle is used by Dutch citizens for about half of their journeys while the people in other countries, scarcely use bicycles for their movements. Similarly, Dutch people walks more than the citizens of other countries and their walking comprises 18% of their total journey. German and Belgians also preferred to walk while Canadians scarcely do it. German use public transport more than mass people in other countries do which counts 18 percent of their total journey.
Based on the bar graph, more than one-third Canadians use cars to reach their workplace because they think they do not have any better alternative. Three out of ten persons use personal cars for their work-need while more than 5% people are forced to use personal cars because they work night shifts. One in every five persons thinks that journey in a car to the office is more convenient while just over 10% citizens do that for faster travelling.
Model Answer 2:
The table compares the types of transports used in four countries – Canada, Belgium, Germany and Netherlands while the bar graph presents data why Canadians prefer personal cars to reach their offices.
Getting back to the details, cars are the most preferred mode of transportations in all the four given countries and the percentages of tours made by citizens in these countries by cars ranged from 47 in Netherlands and 90 in Canada. In Netherlands, a high proportion of trips are made by bicycle, more than one-fourth, and on foot, 18%. The highest percentage of public transport is used by German and that comprise 18% of their total journey.
The bar chart, on the other hand, explains why Canadians prefer cars to commute to their office. Interestingly, the majority of the Canadians (38%) use cars to reach offices since they do not have any alternative. A sizable percentage said using cars is more convenient (12%). Other factors listed seems like more related to people’s need than preference as working at night shift and work related needs.

Report